Fractal of Doom Update
Sorry for not updating this for a while, but I have been away from civilization for the past few weeks.
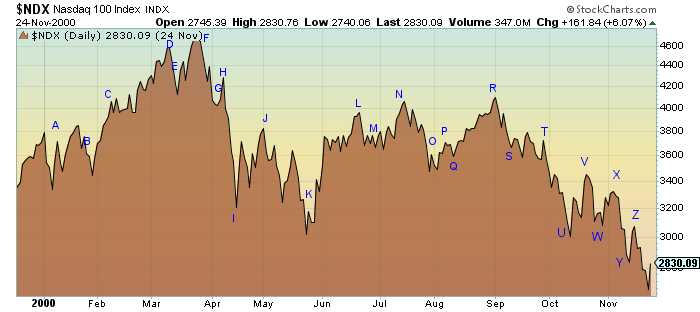
First the reference chart:
Now the current GDX chart:
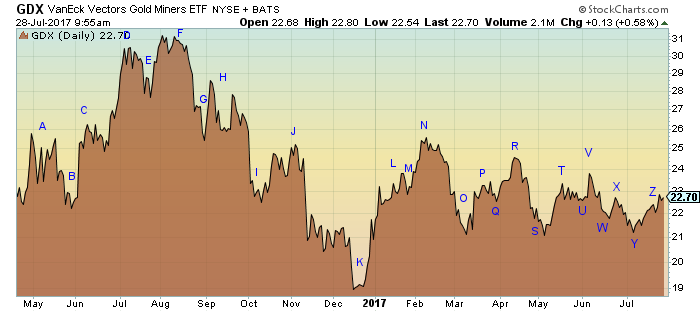
I think it is obvious that the pattern has broken down. Starting around Point ‘T’ it has moved more sideways than down. Can’t say for sure, but I believe that it might have been because the dollar has been so weak lately. PM’s want to go down, but the dollar won’t let them. Anyway, I’m going to call this a bust.
I would like to say that I still think this is a valid pattern though, and would encourage you all to keep an eye out for this formation in other stocks. My purpose in presenting this to the board was to show you all the pattern and show that you could trade it effectively. It hasn’t worked out this time, but in stocks that aren’t so heavily influenced by other factors (like the dollar) it can still be a great indicator (like the head and shoulders pattern, triangles, etc.).
Very complex pattern.
You may want to look into the Three Peaks and Domed House pattern that George Lindsay explored, along with Tim Woods.
Similarly complex .. you’d think it would never reappear. But it does, fairly often.
http://thepatternsite.com/3peaksdome.html
Thanks Ken takes a big person to admit they were wrong and I salute you.
Also bloody glad it did not work 🙂
Spooky HUI is still on track!
A pattern works until it doesn’t. Spotting that and acting accordingly is the important bit. Thanks Ken. P