THE MOST BULLISH GOLD CHART ON THE PLANET
Rambus produced a similar chart back in 2016 when it appeared the Gold bear had ended.
He actually has been following this Gold:XAU ratio long before that as it was obscene but amazing how Gold Stocks
were lagging the Price of Gold all through the Great Gold Bull of the 2000s
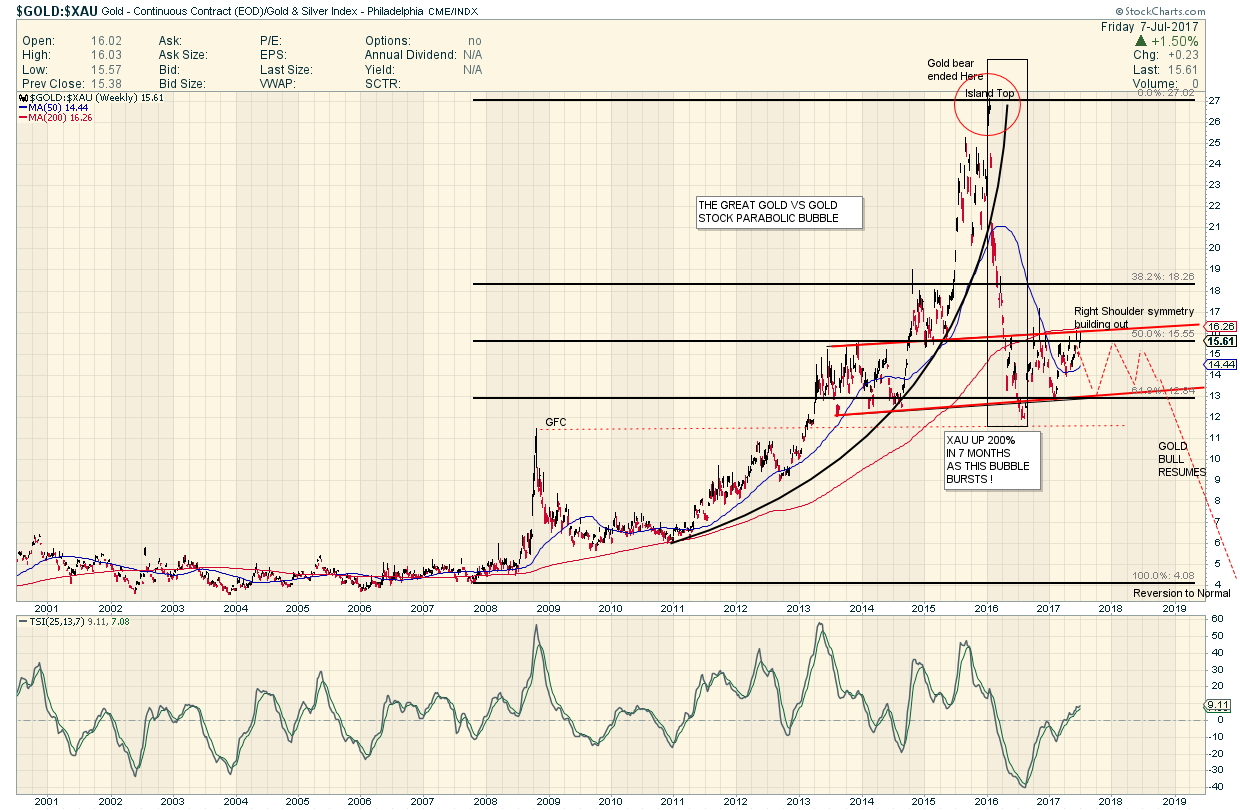
He showed us that the Parabola had burst ( as they all must) and had a first bounce target at about 12…which has been the case.
From the Bubble peak in January 2016 to the target in August was the time when the Gold Stocks went Nuckin Futz.
Since then the ratio is building out what will likely be a symmetrical ( in price and time) right shoulder.
If so then we can expect another 12 months of sideways chop in the Gold market…THEN when this chart finishes its business…BAM…to the Moon Alice.
Year ye Hear ye….By the Powers Invested in me…. as Fullgoldcrown , I Hereby Decree…. The Great Bear Market
(2011 to 2015 ) has Ended …Long Live the Bull !
Hi Fully. Great chart. Thanks. If we have a right shoulder that is symmetrical in time, we should see this ratio break down and gold take off this Autumn (Fall). The left shoulder built out from mid 2013 until the Autumn of 2014 (Maybe 15 months). The right shoulder began in mid 2016, so breakout, downwards, should be this Autumn. This ties in with a lot of other analysis from multiple sources. The bullion banks have just offloaded an enormous amount of their short positions and are getting long. They are always right, and are getting ready for the next upleg (In my very humble opinion).
look at hui:gld
same ihs as 2000