Getting Critical
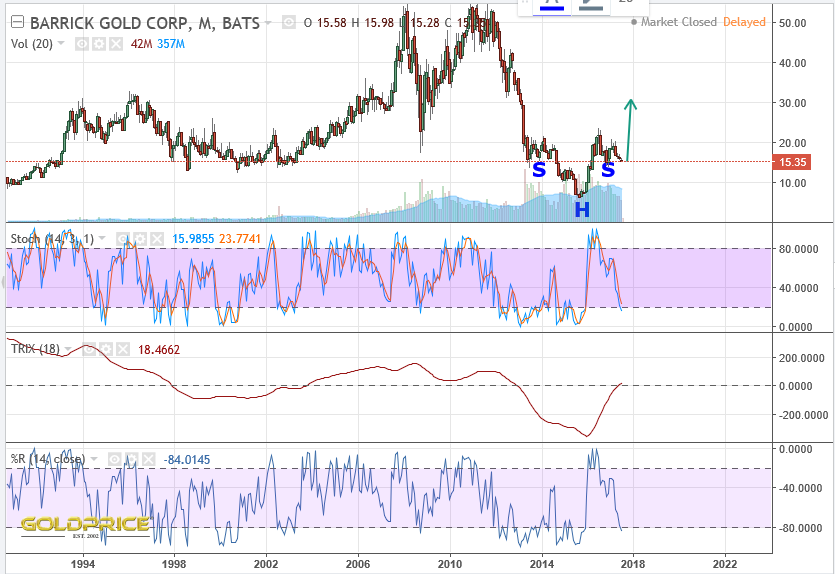
Our patients (PM’s) appear to be on life support. They need to start making a strong recovery soon, or they could be dead in the water for quite some time. I’ve been looking at some individual PM charts, and I’m seeing a mixture of a) bullish inverse head and shoulders b) potentially bullish falling wedges and c) dead ducks. This could turn into a massacre if we don’t turn around soon. Here are 3 examples that aren’t dead ducks yet.


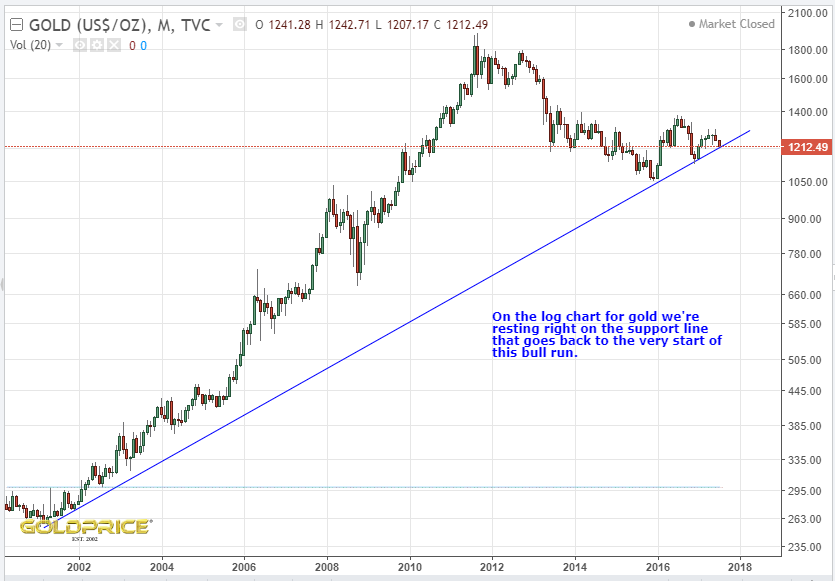
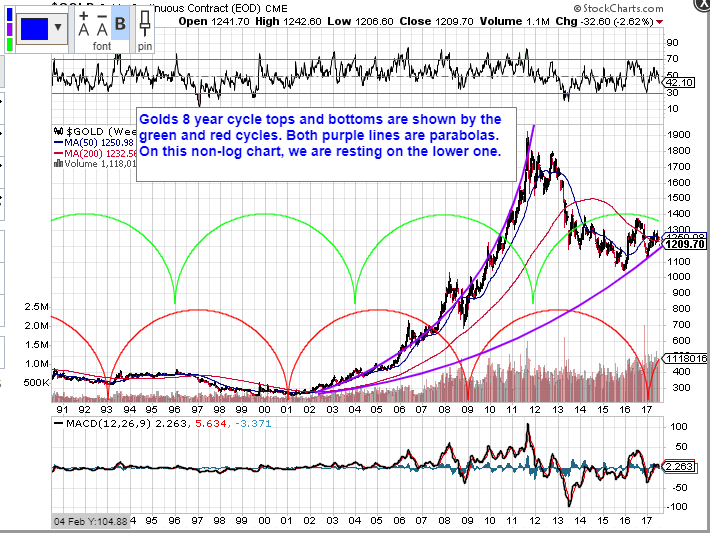
I’ve also had a look at the latest COT numbers and yes, we are in a position which is supportive of a rally, but it doesn’t guarantee it. The gold price chart viewed on a log scale appears to be resting on its very long term support line. When viewed on a non-log scale you can apply 2 parabolic curves – the first is the actual path taken to the 2011 top and the other is gathering pace on a slower timescale, acting as support. Once again, we’re resting right on that support now.
What does it all mean ? We’re clearly at a major decision point. Much more weakness and the bull case will vanish in a puff of smoke. Golds 8 year cycle, bottoming indicators/CHF-USD ratio, weakening USD and the commercial/speculative positions are supportive of a rally. Others argue the decent US jobs data, rate rises, strong SM and USD-JPY ratio will drag PMs down.
To me, the charts are pointing to an imminent upturn, but some of the arguments against that are convincing. What do you think ?
1180ish spike low with 1200 as the main support consolidation B4 some kind of bounce. Otherwise, lets flush this thing and get it over with.
Agreed.
I think this is an excellent summary Northstar…that’s what I think. I also think its too uncertain to have a large position…but I am leaning bearish with Rambus.
Great charts NS.
My opinion changes by the hour and that depends on the last site I visit! But, and its a big But, I feel like we are back to last Nov/Dec and we know how that ended. So we are either at the start of a bull market in Miners, or it is the shortest bull market ever!
I am staying in for now and I see a bounce in August, a pullback and then we will see. Still could be 2018 before anything big occurs by which time many will have walked away and who could blame them!
Pretty much my sentiments OJ 😉
This is how I feel as wel ha. If it weren’t for the COT and sentiment I would be more firmly in the bear camp. I see one of two potentials 1. A turn is very close in a day or two. 2. A turn is close (within 5-6 trading days) but we get hard sells in miners and gold first.
So why not just go long now. I could see the miners dropping10% in a few days and that the only thing that holds me back.
I heard plunger say something like part of shorting is about knowing when to push the short. So that’s where I sit until trend changes even tho it’s uncomfortable.
I agree, we could see a further 5-10% drop, but it would need to turn around fast to get the bull back on track.
Cheers Fully. Spock is in the bull camp.
Thanks NS I feel better now 🙂
Would feel better with more bearishness. Still too many (not on this forum) believing in turaround. I agree with thesis that something may have changed, and the recovery from jan 2016 was bulish, after 4 years bear. Now it is difderent I believe with less room for errors. Maybe we have to wait until SM gets its first corection before touching miners again, altough I do see good value in some explorers.
I believe we need more and bigger decline of gdx as up too now decline is gradually, and even if we have recovery soon, final low is not due any time soon, as we broke suport so it will take time to absorb all this selling.
Maybe Alex. I’m not sure we need a bigger drop – if the cycles hold true, we should be running out of time. On the other hand, I could be way off the mark !
I run thru the financials and compare the names to where they were and these companies… especially Newmont – it is in so much better shape than when gold was 1200 on the way up. I don’t think if we retest the lows in gold at 1045 that the miners retest their lows. They are simply in too good shape financially and operationally at this point. The ONLY difference is perception of where the price of gold is headed… not the internals of a company like Newmont or Agnico.
Cycles?? These same cycles flashed buy signals since weeks or was it bye? Sorry, but on this forum I have seen some cycle analyst remain bullish all the way down, other cycle analyst Hadik I folowed was bullish some months before but is sounding more bearish now, altough he is calling for a spike low next week, so we will see about that. I believe even if we see a rebound after first a big spike lower or not, the final botoom needs more bears and additionally technical divergences that are not yet there I believe.
You may be right Alex. I agree a spike to around $1180 is likely. Much lower than that and we no longer have a bull.
Very nice work Northstar. 😉
New , hot money has to leave elsewhere to jump into gold. Which sector is turning down and making them hunt for the next big play??? Coffee, wheat, concrete, sugar all getting the fresh money lately. No definite bottom for gold or world event to say “buy me ” if I was an outsider.
Might as get out of gold and go chase what is actually moving up.” Why fight it mentality” is not out of the norm here.
I think bull markets start slowly, unnoticed by most. The ‘hot money’ comes in much later and drives the parabolic top. The gold price could be past $2000 by then.