Fractal of Doom Update
First, the charts –
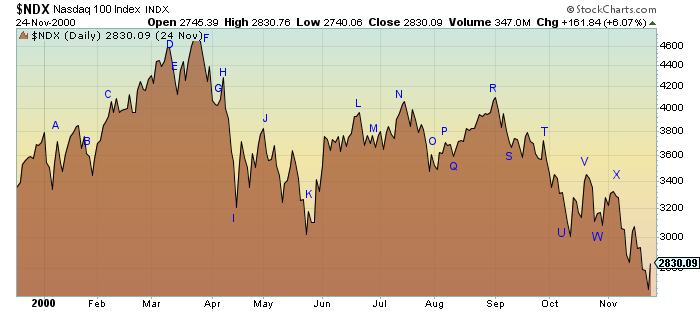
Reference Chart ($NDX from 2000):
Current GDX Chart:
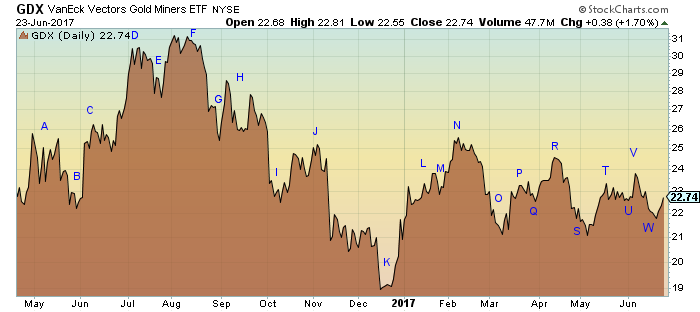
As predicted, last week was an up week.
Last Week
What about this week? The $NDX reference chart was up for 5 days (point ‘W’ to point ‘X’). We ended our decline on Tuesday of last week, so the middle of the coming week we can expect another drop. Can’t say how far, as the last drop was mild – but once again it kept me on the right side of the trade.
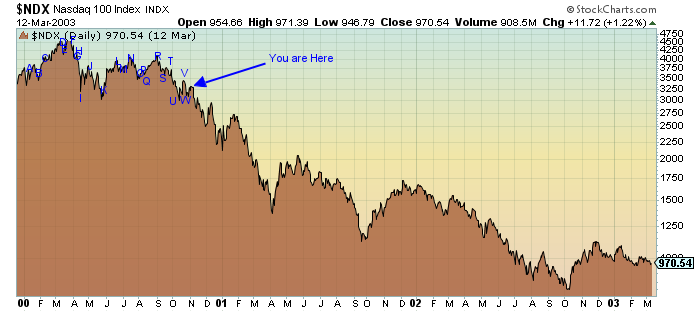
Here is the overall reference chart:
Good luck all.
Thanks Ken, always good to see the opposing view. Time will tell!
At least you are keeping us grounded 🙂
Thanks for posting Ken. That thing is still working.
Is it? I must be missing something as if you over lap them they do not seem to really match up in my eyes.
me missing it too, $200 gold target????? The world must be turning just fine. The Nasdaq bubble was just the flavor of the day for the big money to flee and park at that time. Gold has not yet had the mania as the to be place yet for the herd to jump into. According to the chart silver will follow gold down. Have seen many charts that compare silver to soybeans, so beans to the floor also????
Highroller – not sure exactly where you got your $200 gold target. That is not what I have projected. See side bar under ‘Fractal of Doom’ for my actual projections. Thanks.
Odd Job – Have you taken the time to match letter to letter, chart to chart? The correlation is uncanny. By following the direction changes I have done Quite well over the past few months.
Ken, No I must admit I have not, but I have been looking at charts for 35 years now (probably not as long as you) and if I take a step back and just visualise the two I really cannot see a match, which I can with many of the charts FGC has produced and the comparison I am often refer to of the HUI now and in 2007/08.
I just wish I had an old overhead projector and some acetates and I could compare the points (that shows my age) :-). I am sure there must be a more modern piece of software that can do this?
As Highroller posted re the gold price, if GDX is going to 8 then I assume gold is going to at least $4-500. I am not saying this is impossible, as nothing clearly is in the mad world we seem to inhabit, but do we seriously believe that is a possibility with all of the conflict we are seeing and all the fiat money?
Having said that if it is working for you great, for me its the graph I posted from last August and we all have our own ideas that may work for us. One thing I do know is that plans only work until they don’t. To quote the great Mike Tyson, ‘everyone has a plan until they get punched in the mouth’ The market can have the same effect as we witnessed last August.
I would like to take this opportunity to say I appreciate the civil debate here and at most posts on the tent.
This is what draws a large audience here. Honest two way debate.
KenS Fractal of Doom would incite a riot at any other PM oriented board. There would be profanities personal attacks and
gnashing of teeth .
Thanks guys
I appreciate this post Ken. I’m leaning heavily towards a sustained rally over the next few months, targeting HUI 340. BUT, I could be wrong, so differing views are great to hear.