HUI, Off to the races
As you will recall, based on the work of Sir Fully on the HUI, I compared the 2007/08 period shown below for the HUI and added a possible route from May to the end of the year. Apologies for the quality of the drawing and I am sure that many who post on this site can do much better than this, but I just keep seeing this symmetry and it is still on target.
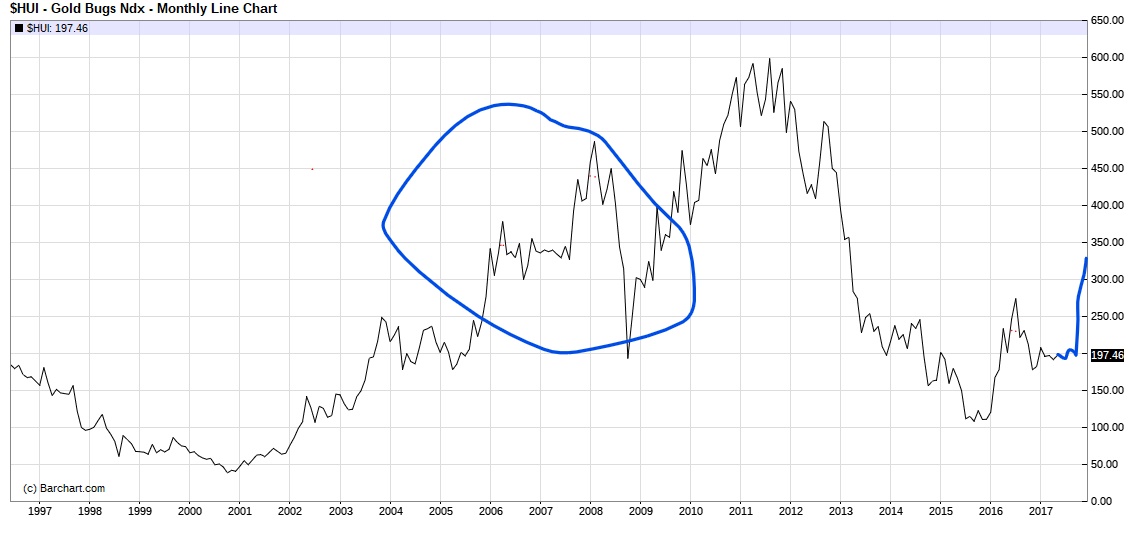
This is where we are now in an updated version with the latest 6% rise.

Spooky 🙂
If we get one more pullback in the next few weeks we could then be off to the races in a big way if it follows 07/08. On the other hand it may just take off.
Glad we finally have some confirmation…all roads lead up!
Cheers ES I cannot contain my excitement and anticipation. Yesterday for the first time I thought sod this for a game what else can I invest in, but a day is a long time with the miners. Could be an interesting few weeks.