Commodities
Its way past my bedtime but I can’t sleep.
I am Still Concerned about Commodities.
Graddhy has some really good charts with valid cycles . Specifically the 15 year Cycle.
These are long term charts and they show Commodities have bottomed . Convincingly
However this chart is at least concerning and at most very scary !
…Commodities.. I am using the CRB as its the longest standing Commodity Index…It is flawed as it is heavily weighted in Oil….but hey Oil is THE Commodities Commodity .
The Long term Chart shows a breakdown below very very strong Support. Maybe this was a false breakdown and now we get the strong move up. BUT…this has yet to be proven. Maybe we have just had a backtest before we go back to the future and 1960s prices . Either way its one to watch.
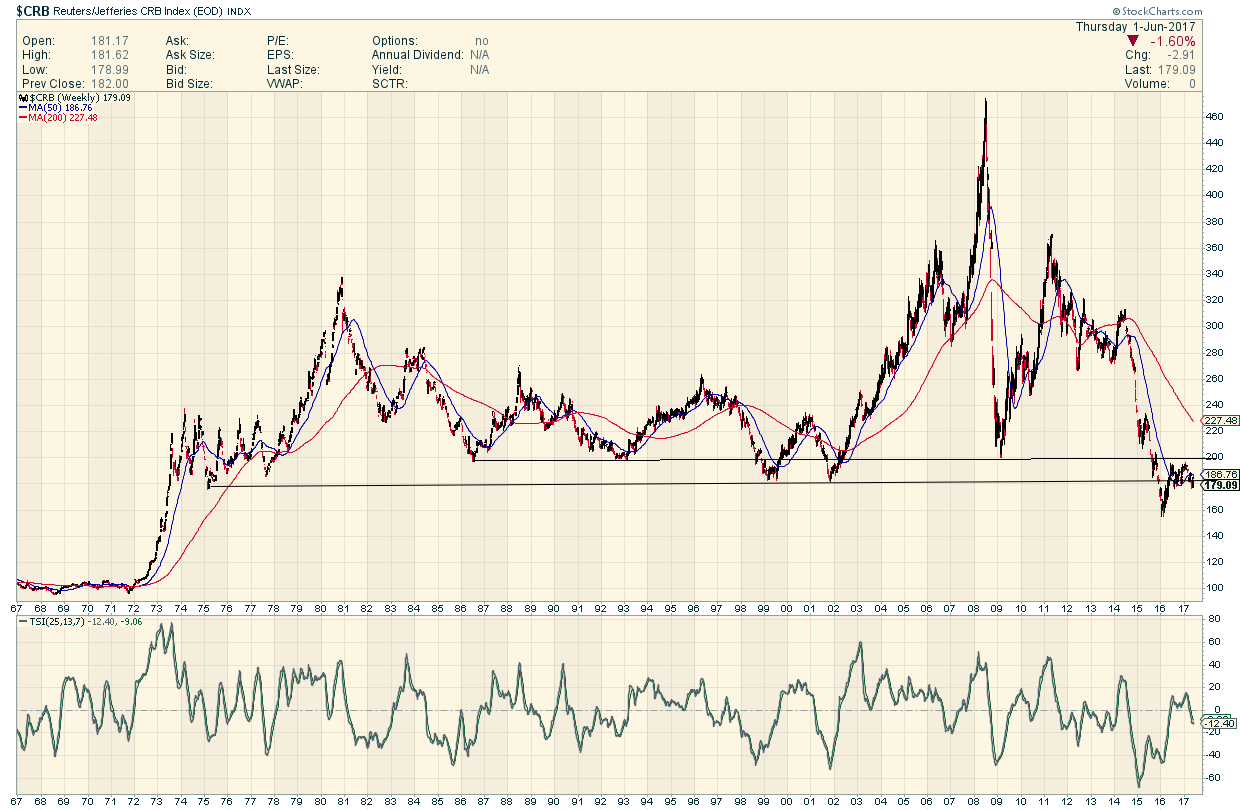
We need to see this support / now resistance taken out for the bull in Commodities to be on.
So lets zoom in and see a weekly 3 year look
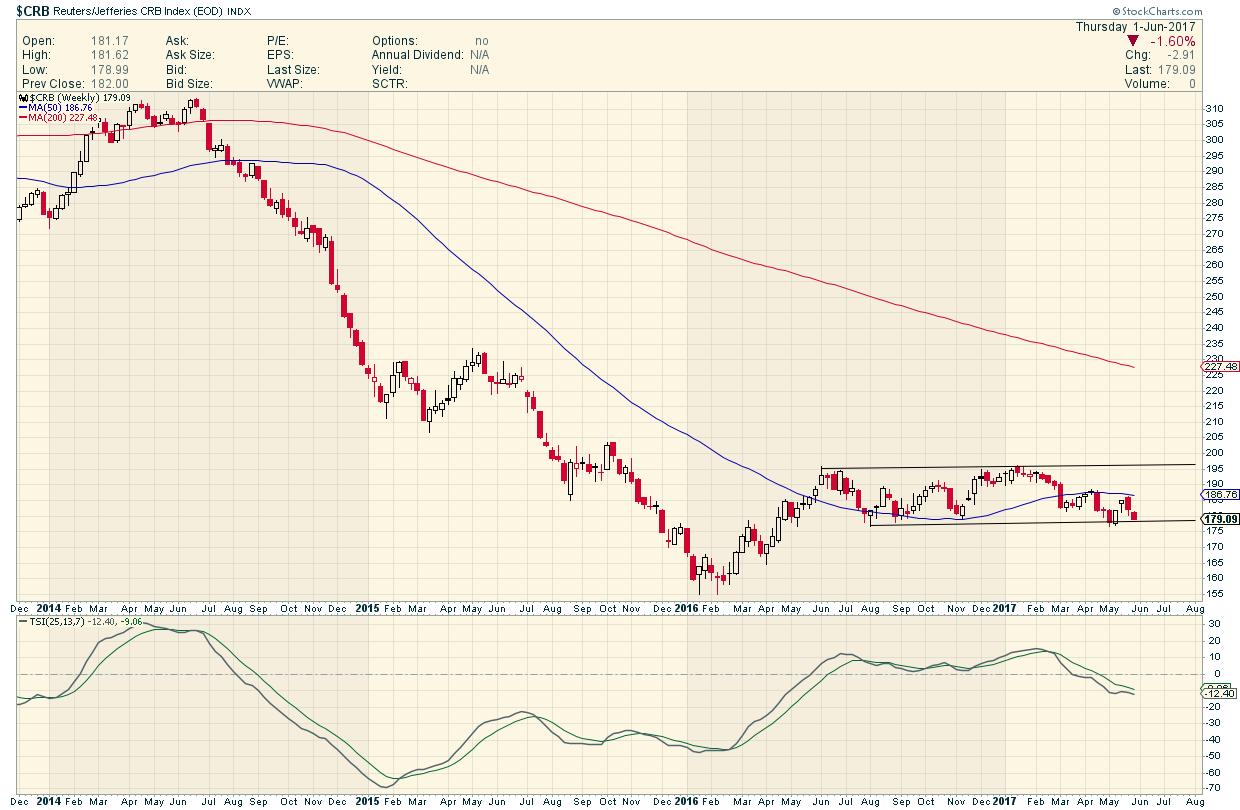
Not all that inspiring yet. Bounce …Please ?
Daily
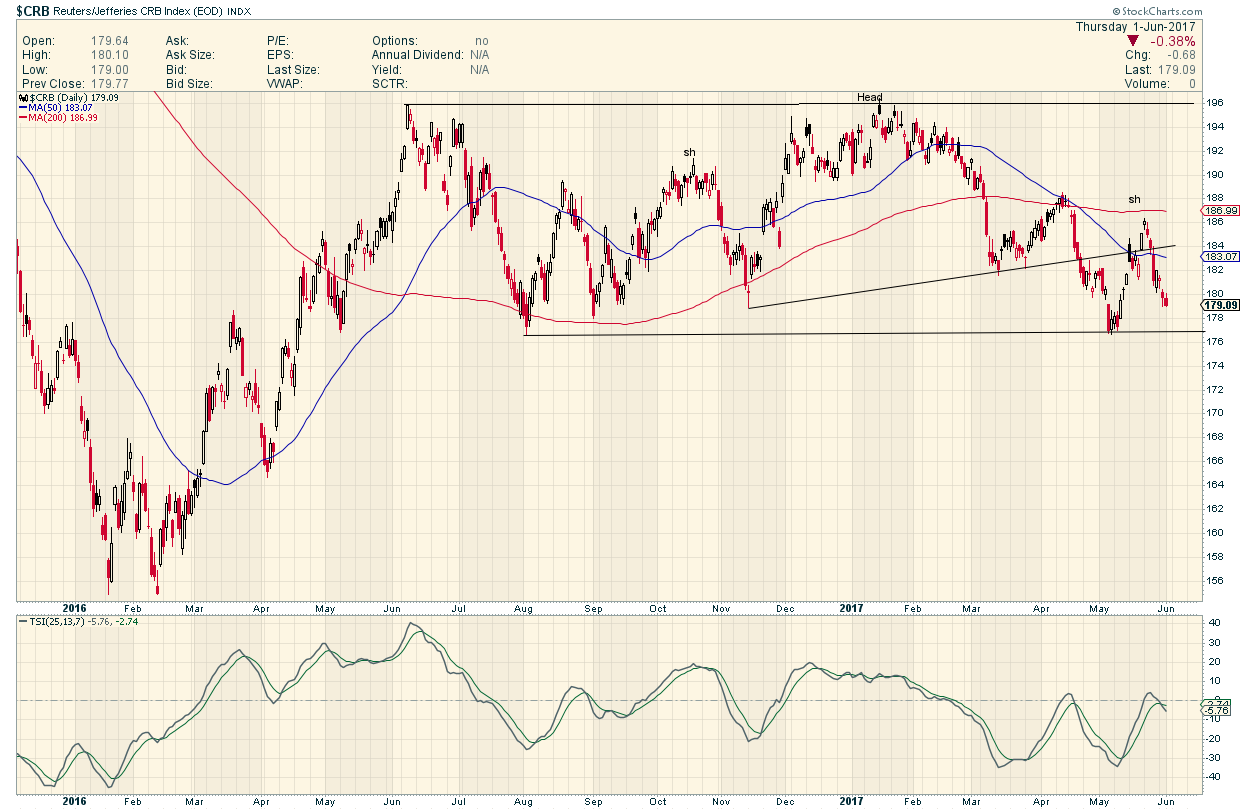
I would love to see the turn…asap please.
Its 9 years after the great Blow off and Crash…is that enough ?
What I can tell you is Plunger is writing an epic historical feature exclusive for Rambus Members this weekend.
And there is something very interesting and important about year 9 after a commodity bubble burst.. historically .
No more hints. This piece actually will take perhaps an hour to read and digest. Is it worth the price of a Rambus Subscription to see some fascinating financial history replete with cycles . 400 years of history repeats is nothing to dismiss.
If you think this is all just hubris and promotion…that’s your prerogative. But this is some serious SH!T with important implications to say the least IMO.
FGC
Unnerving position just now. It could go either way, and there are good, convincing arguments on both sides.
Excellent post Sir Fully. Indeed most scary and unfortunately is what I believe to see as well in all different charts of many different things. I want to be a BULL …. BUT. I believe to see the WORSE to come in EVERYTHING as for markets.
Need to try to maintain objective.