STEEM is picking up Steam !!!
Yesterday I made a post on STEEM, a cryptocurrency which at this moment in time has I very high potential: https://goldtadise.com/?p=404224
For those of you that are interested and maybe have set up an account to trade it, I make a quick update:
Yesterday I showed a STEEM chart relative to the price of ETH Ethereum (link above): on this chart STEEM had broken out of a bullish descending wedge and was backtesting the BO. At the moment it is still backtesting the descending resistance (now support) line, which it has now touched about 7 or 8 times, riding the support line down like a rollerskate rider !!
The following chart is STEEM relative to BTC Bitcoin (first the big picture and then a zoom):
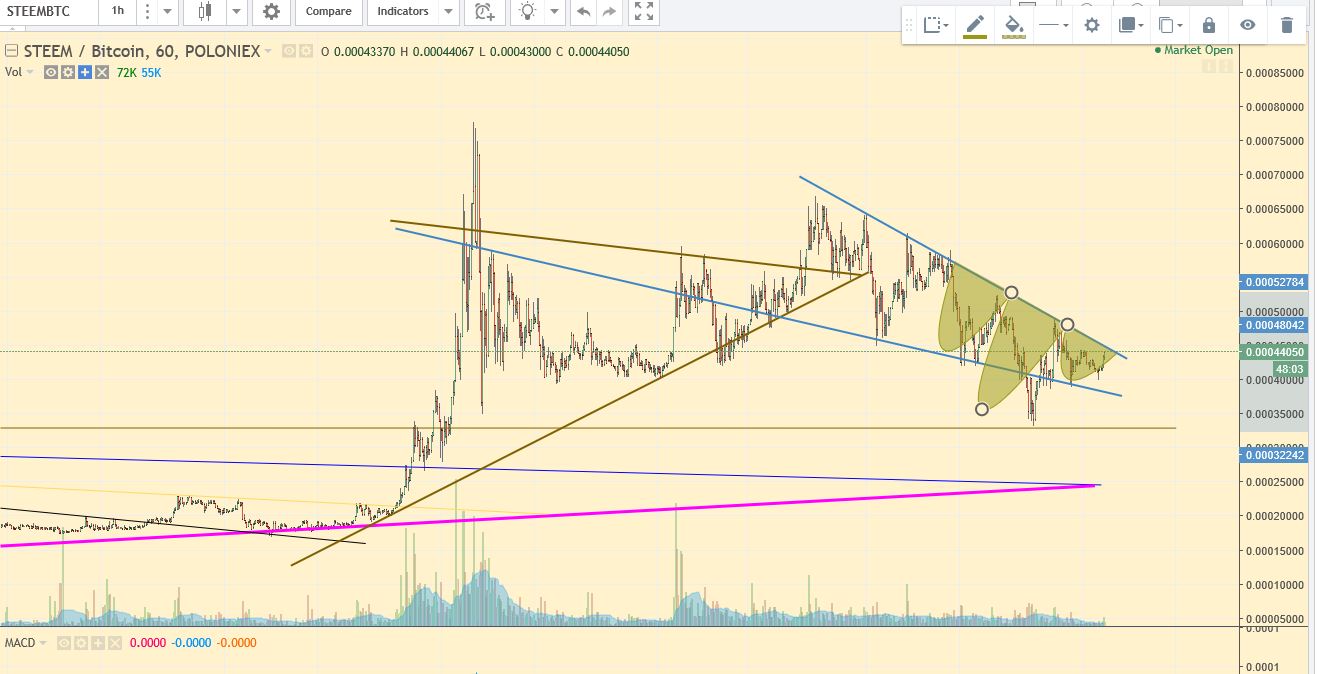
You can see the inverse H&S pattern forming on the descending resistance line of the bullish wedge, ready to break out.
Now here is a close up:
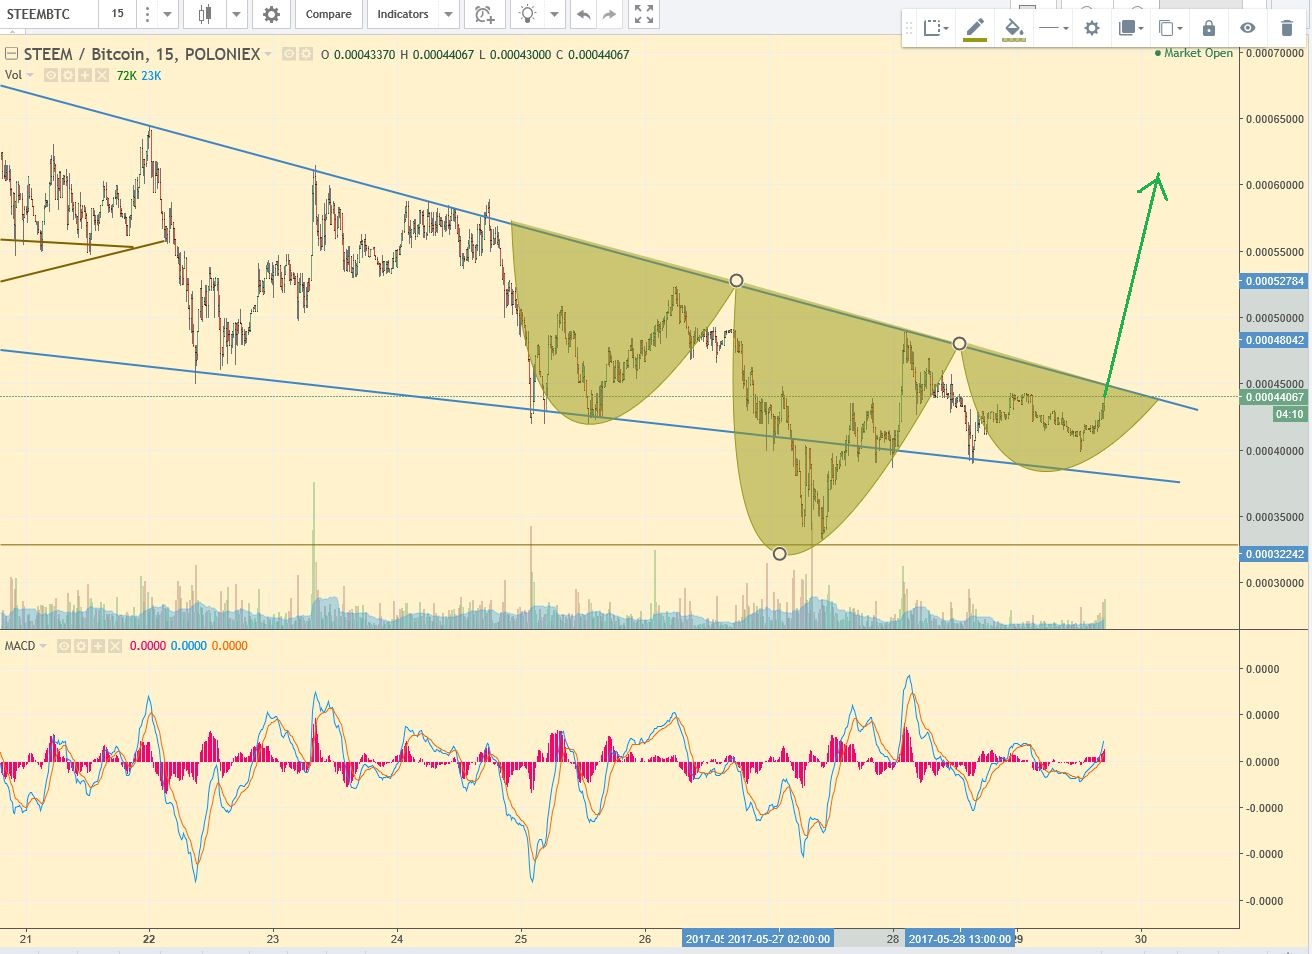
As you can see a false break out formed the head of the inverse H&S formation and STEEM is now picking up steam in order to break out of the bullish descending wedge.
I personally believe this BO could be impressing ! I will keep you updated ! Cheers !
Thanks Dangermouse…following along with you
OK, so I finally decided to give it a try and buy some crypto stuff. If anyones interested, I just installed the Coinbase app on my phone, registered and bought Bitcoin, Etherium and Litecoin. Even taking the very small fee into account, I’m in profit on all 3 already. Rock n Roll.
Chaching….who need a job anymore ?
🙂
So I am curious what you guys are using as secure wallets to store these ?
I want to get a Ledger Nano S which I understand has a new app now to store Ripple also but it is not out until July and I want to buy now.
So until then I will have to find secure storage somewhere.
I use http://www.gatehub.net and am happy with it !
I wait for cold storage until they support multiple currencies.
Guys, which exchanges/trading acccounts are you using to do your BTC/STEEM buys?
http://www.poloniex.com
Are you guys aware of this ? http://www.lse.ac.uk/collections/law/projects/lfm/blockchain/Zellweger%20%20C.pdf
Central Banks moving into the Crypto space to develop their own currencies.
Seems to me this adds risk to the private Cryptos no ?
True; there will be multiple scam coins in the cryptospace !
I suggest you watch clif high’s latest YouTube video called “Crocodile cryptos and pissin’ in the woo-woo pond”.
You will get phantastic insights on whats coming down the road, also in the PM space !
Let me know what you think about !!