GDX
Looking through an “old” chartpack I haven’t used in over 2 years and this chart appears. Why would I have placed this line over two years ago?
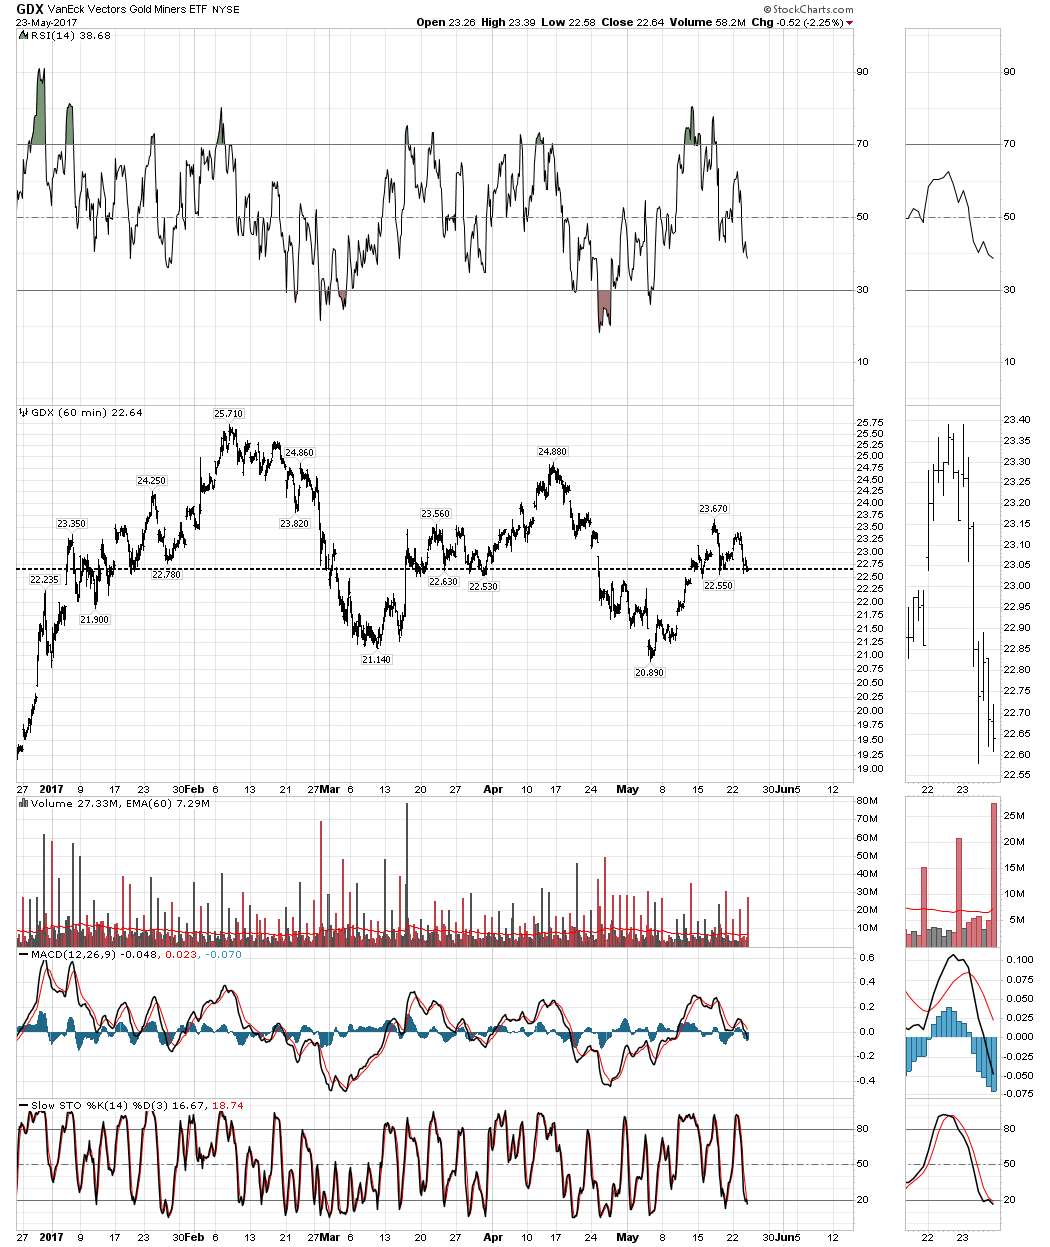
Went back on the time scale and it looks like that was the “top” in early 2015 that led to the final lows in early 2016! And here we are again! Interesting
Here’s the entire picture with my old annotations removed save this single line.
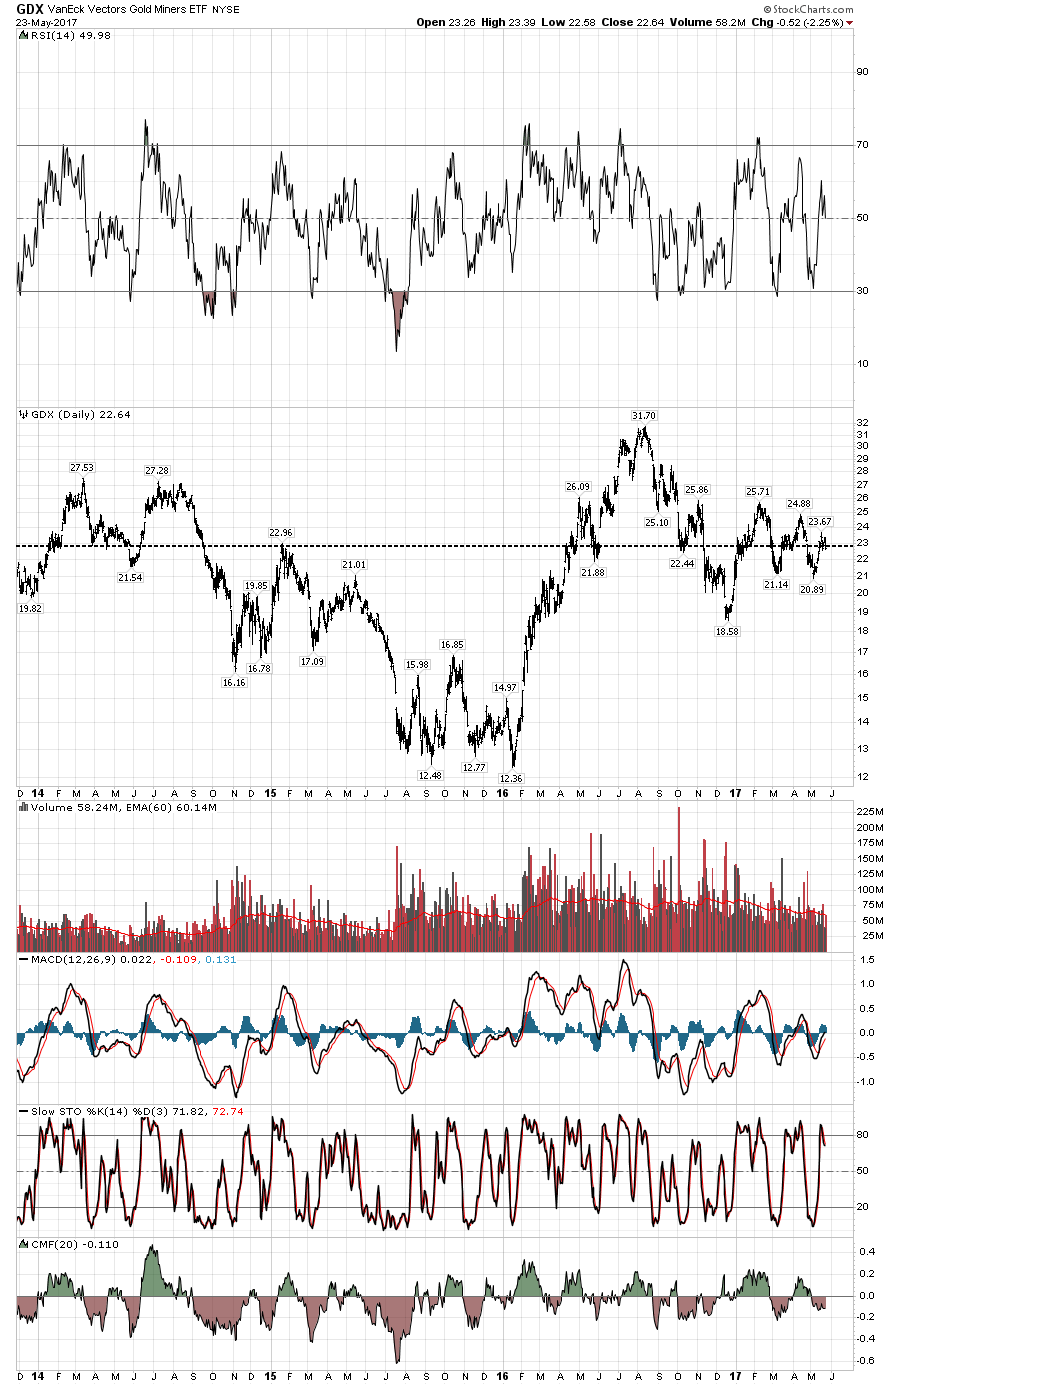
Appears to be an important line of demarcation, IMHO – BULL above – BEAR below
“Old trend lines never die” Rambus