GDXJ backtest
Nightingale showed the perfect backtest in $Gold and how it backed off.
SilverFox then showed a perfect backtest in the HUI in a post below mine.
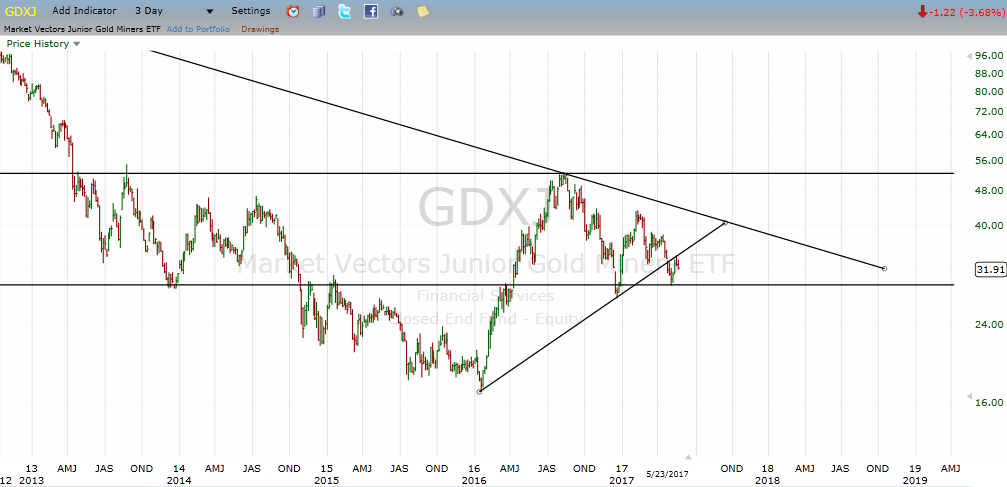
The same backtest is seen perfectly in GDX… and lastly I wanted to show the perfect backtest in GDXJ as well.
When I look at all of these things together, it looks awfully bearish. Backtests in gold and every miner index I look at. If it looks like a duck…
In the chart below, you can see that each successive high is lower than the previous. Its moving in a reverse parabolic fashion. If the long term support level at 28 breaks, it’s in big trouble. Honestly, the whole thing looks like a reverse cup and handle.
Completely agree with BT completed on all miner-indices.
An inverse CupNHandle … I have learned about that and yes, so they exists. Nice find. As a rule of tumb when BO from the Cup (dec-17-low) it has 35% (max or so) potential to decline which would bring to aprox 18 which is slightly above dec-15/jan-16-low. Potentially DB and who knows lower. IF so, the coming decline could go very fast. Fasten your seat belts.