Fractal of Doom Update
First, the charts.
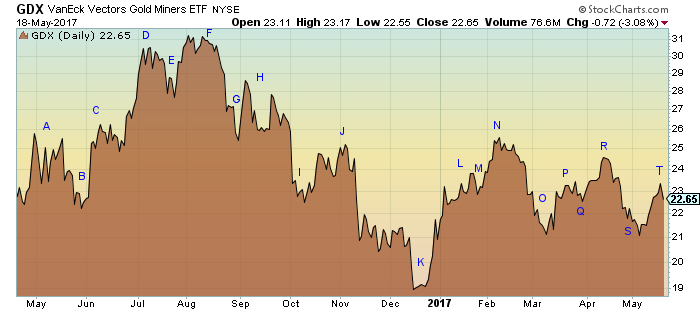
Current GDX Chart
Reference Chart (NDX 2000)
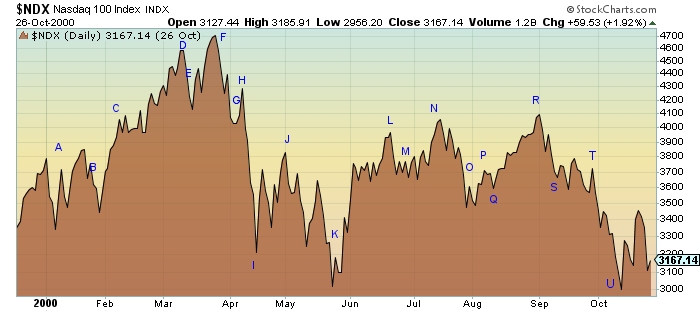
As you can see, the correction from point ‘S’ to point ‘T’ occurred as predicted by the reference chart, however unlike the reference chart, GDX had a sharp upward correction rather than a flat correction.
It appears the correction is now complete. I base this conclusion on the fact that the time from point ‘O’ to point ‘R’ is the proportionally the just about same as the time from point ‘R’ to point ‘T’ in both the reference chart and the GDX chart.
What this means in a nutshell is that we are at the very beginning of a Significant drop in PM stocks. This should be a ~15% decline in 2-3 weeks (GDX 23 to 19) and take us back down to the December lows. This would be point ‘U’ in the reference chart.
EDIT:
Should have included the bigger picture chart also. Here it is:
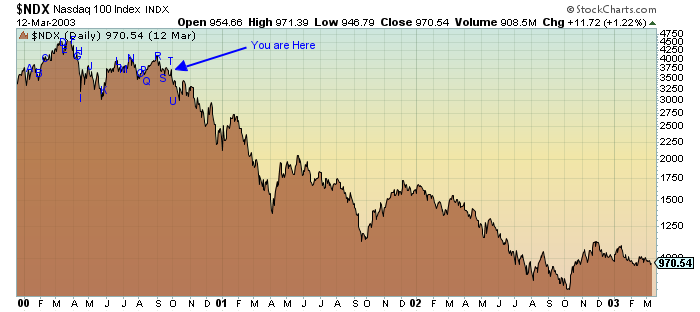
Gold can’t get off the mat even with a rapidly falling dollar. I have to say this is looking better all the time. I’m almost flat PMs. Have been since B4 the French elections. And it feels good. lol