USDU – Rally Back Up To ~ 27.10 Then Fall Back To ~ 25.70?
Daily SMA 200 had been acting as support, price fell through it, now looks as though it wants to test it as resistance from below:
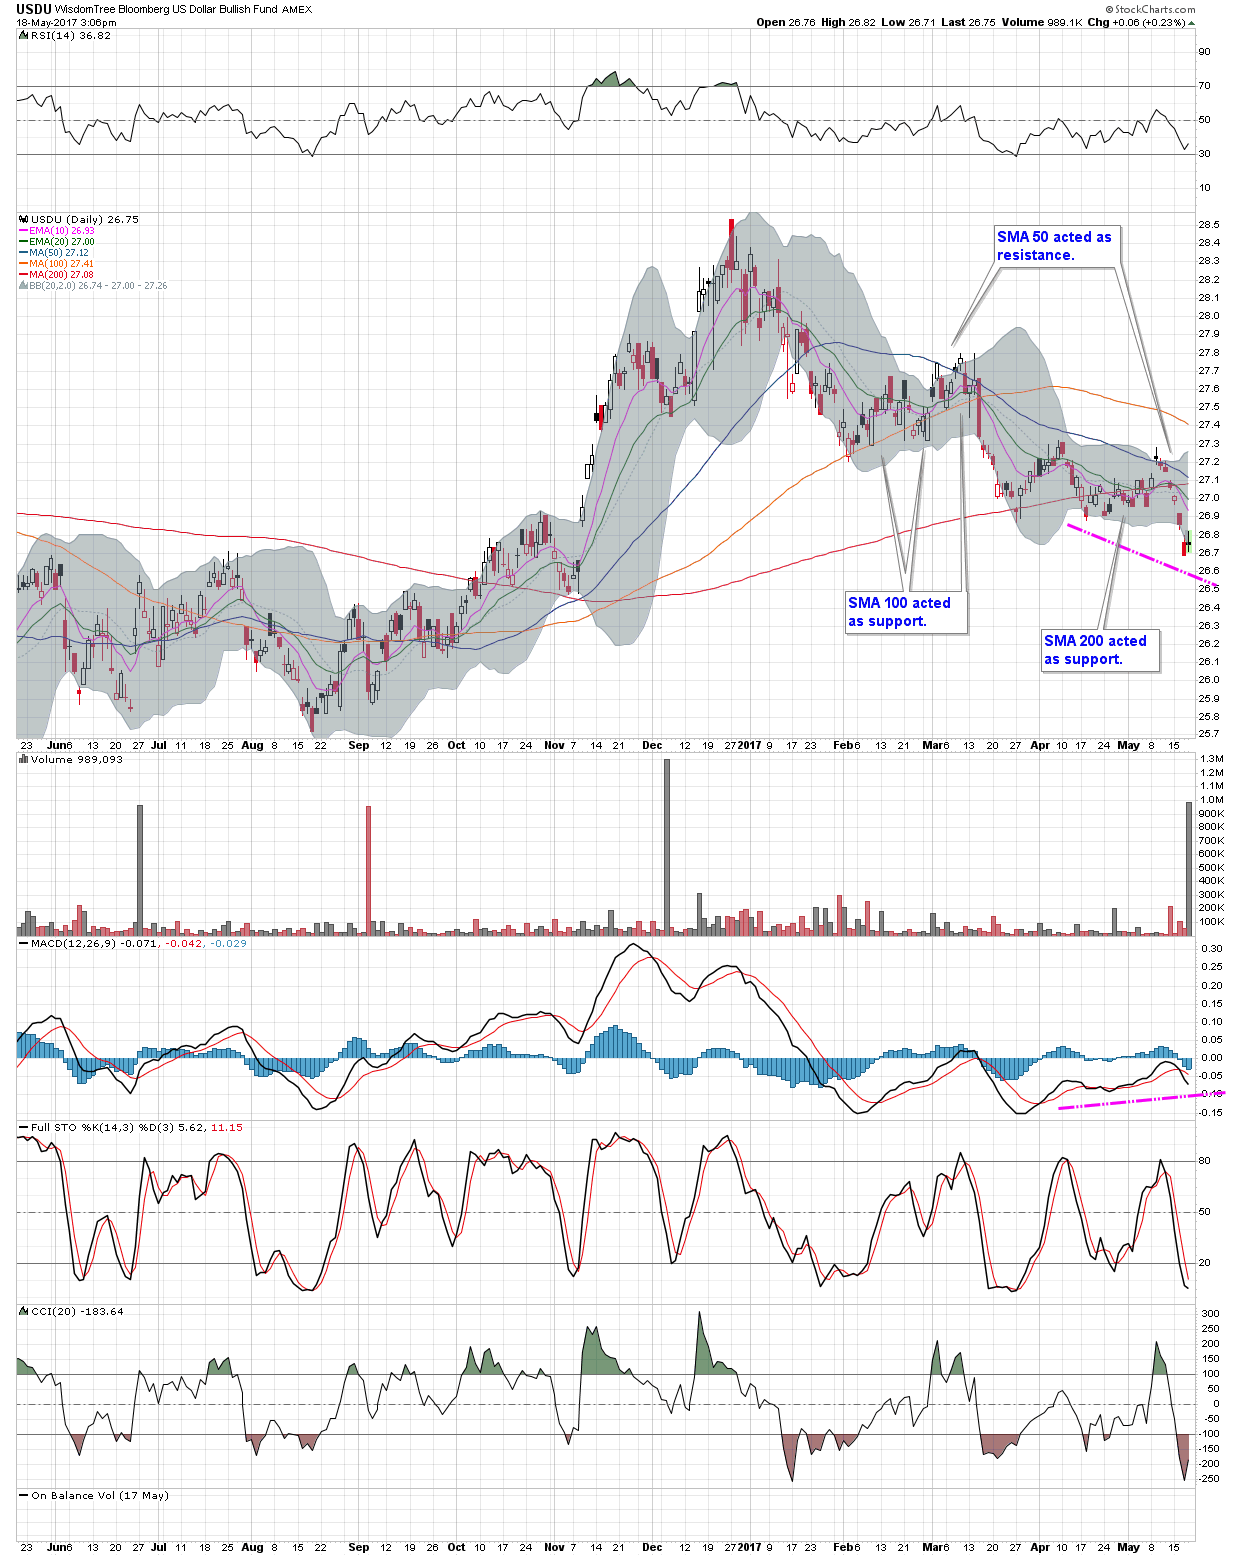
Possible strongly slanted H&S targets ~ 25.70, S&R line resistance would also come in at ~ 27.10.
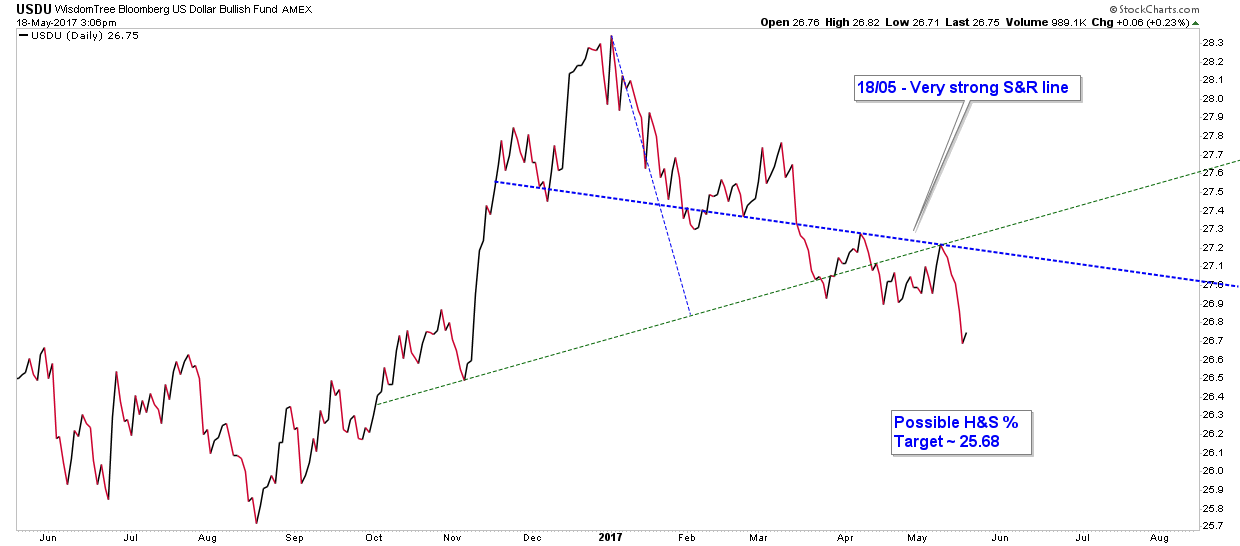
Last possible Fib retracement level being tested, and holding, as support. Price previously found support at both higher Fib r. levels
and bounced around them for a while, probably because they were also ~ MA levels on the daily chart above.

5th reversal point of expanding wedge building out on the weekly.
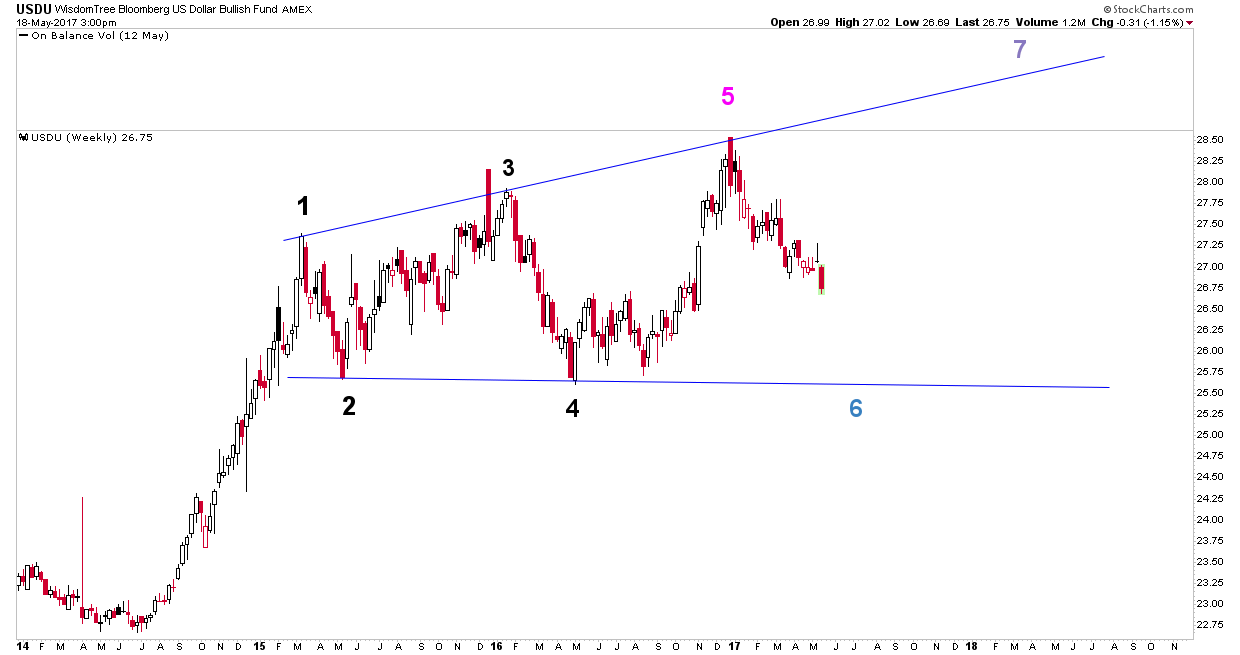
Bottom channel support on above weekly comes in at ~ 25.70, which is identical to the ~ target for the possible H&S on the daily.
Coincidence?