Drawing trend lines?
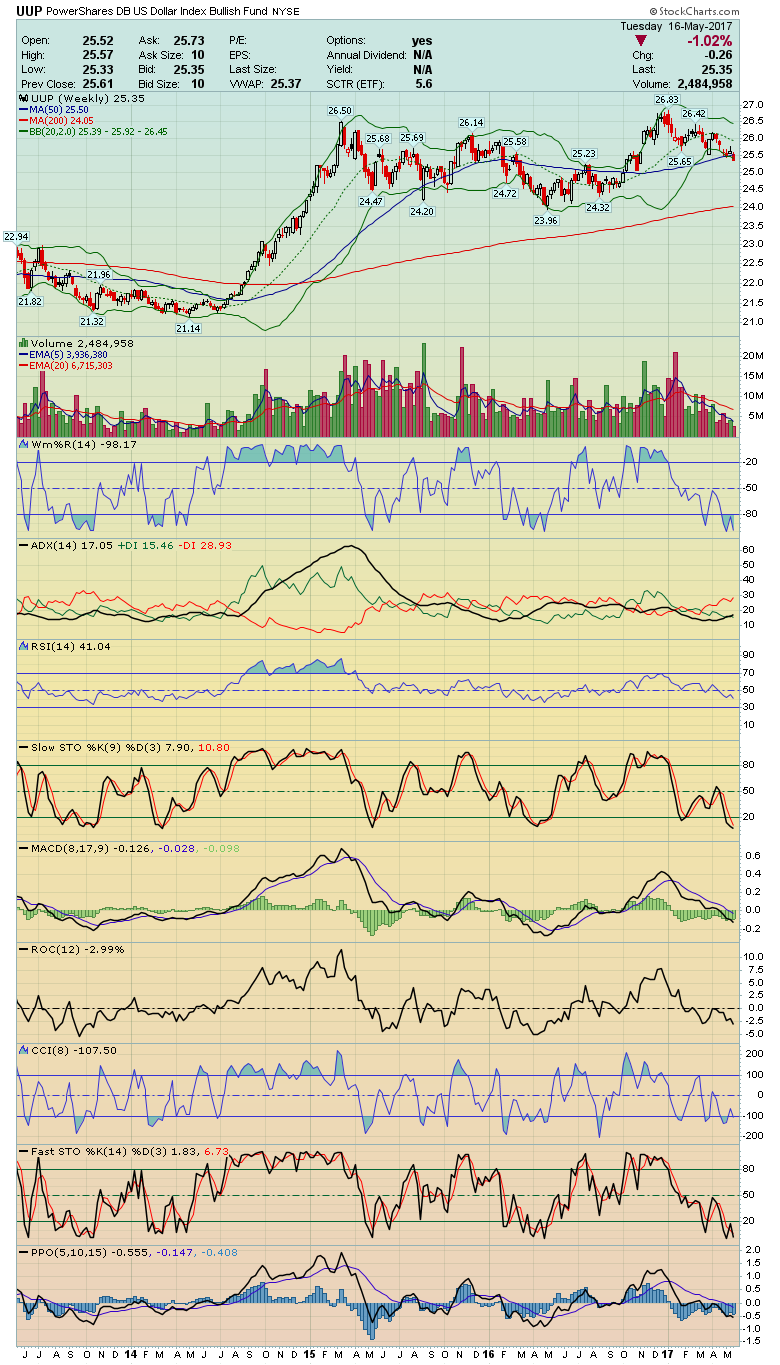
When I 1st looked at the UUP weekly chart I wanted to draw my lower trend line from the 7/14 low connecting the lows from 3/16 through to 9/16. The upper trend was drawn from the 3/15 high connecting the 12/16 high. This has resulted in what appears to be a breakdown from a rising wedge? Now look how Rambus draws his trend lines on the same chart.
https://rambus1.com/2017/05/16/uup-update-103/
Explanation of why he draws his trend lines like he does would be most helpful to me …Mahalo