Some Humor to start your Weekend…
Here is the lazy man’s game plan on PM stocks…
It works like this:
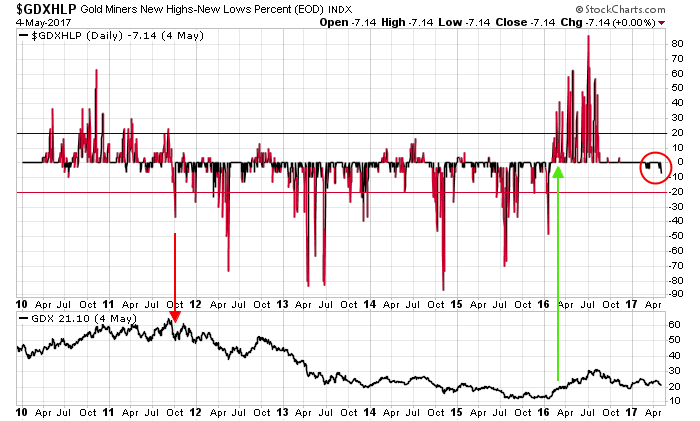
When $GDXHLP goes above 20, buy. When it goes below -20, sell. That’s it. Ha!
The indicator started in 2010, so no telling what it did before that, but the first sell signal was on October 4, 2011 and GDX was at 52.5. The next buy signal was on Feb. 24, 2016 and GDX was at 19.11. Not bad for one buy and one sell, huh?
Seriously though, look at the far right on the chart. $GDXHLP is starting to make its way into negative territory. Oh well, have a great weekend everybody.
Thanks Ken…