‘Fractal of Doom’ Update
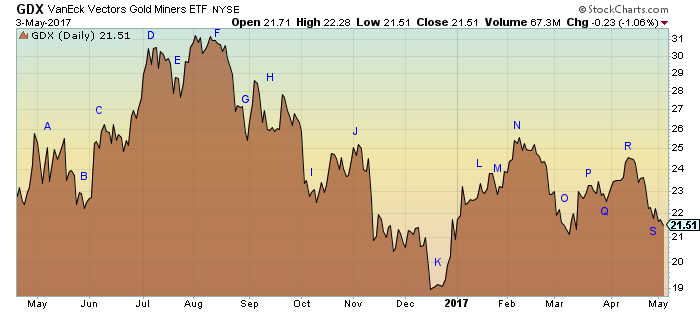
Thanks for the name Sir Fully, I like it. Here is the current chart:
and the reference chart:
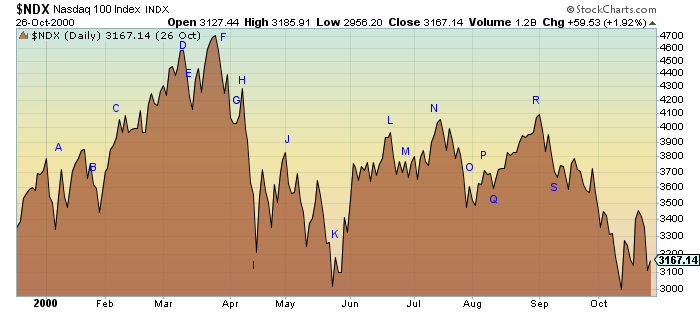
As you can see it is following along quite nicely. We are currently at point ‘S’ on both charts. I sold my JDST today after taking a position on April 21 for a very tidy profit based on these charts. As you can see if you look at the reference chart, we are due for a few weeks of correction (Sep to Oct in the reference chart), but it will not go up very far. By the end of May or early June the pattern says we will drop very quickly again and be testing the December lows on GDX. Hope everyone is ready for that.
Here is the full ‘Fractal of Doom’ in all its glory. If/when we make it to the bottom in a few years time GDX will be 8 or less.
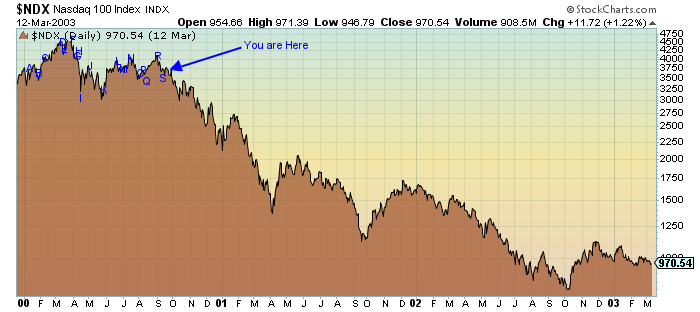
So there it is. Pretty easy to be a successful investor with a roadmap this clear.
Sir KenS You are the devil Incarnate…
🙂
does your map jive with oil as oil peaked with gold in 2011 ????
“Fractal of doom”, I like it!
Surely if the GDX falls to 8, the miners will all have gone bankrupt ?
Not necessarily. GDX 8 would correspond to HUI 60 (give or take a little). In 2003 HUI reached a low of under 40. Some miners went bankrupt but the industry as a whole survived just fine.
I may prove to be wrong, but I just do not see this unless we are going to see world peace and paradise on earth in the next few years and gold down at say $400. We are no doubt in for the usual bumpy ride, but you only have to look at the HUI chart over the last 20 years and we can see what we are in for and I do not think this is it. No doubt we face lots of volatility, but the good juniors will still make money as we witnessed yesterday with Tahoe and a few others rising by over 10% in a day.