The Big Trade-Plungers Trade of the Year Part II
Is the Economy at the cusp of the next recession? or maybe worse?
Part II takes a look at the macro economic backdrop for the trade of the year. Spoiler alert- its not a pretty picture, but don’t think doom and gloom, instead embrace crisis and opportunity! With our understanding of the history of oil we now focus on the macro backdrop for our Big Trade.
“When the tide goes out you find out who has been swimming naked”– Warren Buffet
“This time around everything gets revealed in the next recession”-Plunger
In the next recession those leaning the wrong way… the levered players, will be forced to heave out their non-productive assets at fire sale prices. Commodity producers with entrenched costs will have to increase production as lower prices beget even lower prices since insufficient cash flows can only be recovered through higher volume production.
Today’s economic narrative is inflation is perking up and the FED is finally getting some traction in reviving the economy. Inflation up, Trump up, real estate up, and now the economy finally up. The FED has told us they can finally start raising rates because the economy has reached sufficient strength. If you accept this narrative then you reside with the majority of opinion. You are in good company as they say.
One makes the big money by taking a major position against the consensus and being right! That’s what this BIG TRADE is all about. Its the principle of seeking the outsized risk/reward ratios to make the big bucks. If you had bet $2 on Secretariat to win the derby you would have only won a single buck! Instead we are going to be like Karen Taylor and buy Seattle Slew for $17,500 and collect close to a $50,000,000 in lifetime earnings. Ok, maybe a little hyperbole here, but you get the point. We take on some risk, but we see a bigger reward.
The prevailing narrative is wrong! The inflation is not going to stick! The entire Trump inflation narrative is going to get unwound. Essentially that’s it… that’s the concept for the Big Trade.
Part II provides the economic backdrop for our trade and later in part III I will introduce the specific trade itself. The trade may not seem like a blockbuster at first, because its not a huge percentage move, but its the implications of the trade that make it The Big Trade. A central tenant of trading is to get the main concept right. If one can do that then the other things fall into place. That’s what this is all about, its a macro trade and other trades branch out from it.
The Economy
The US economy sits at the precipice of a recession which has the potential of having major knock on effects throughout the world. It is highly at risk due to the dynamics of extreme indebtedness. The traditional remedies prescribed by the FED are NOT the answers to our problems, on the contrary, they have exasperated our problems. The following topics are mile posts which point out future decreasing economic activity.
Inflation – We are at peak inflation numbers right here-right now. Since it was one year ago that oil was at the bottom, the year over year change is at its maximum right now. This fact elevates the CPI number. Last year inflation was down due to the huge drop in commodities and oil is the key that moves non-core CPI. Going forward from today CPI will decline because the inflation rate of change declines. This is why 2% CPI will not stick. The market narrative is trading off of elevated CPI and it’s the prevailing narrative which is wrong. Inflation is going to 1% and the real GDP is going to 0%.
Economic Expansion– Our current expansion is 93 months long. This is 24 months longer than the average expansion and the second longest on record. But here is the thing, the longer the expansion the harder the landing. The only expansions that had soft landings were considerably shorter than the present one (1968,1984 & 1995).
FED has now embarked on a risky strategy. Their strategy is to raise rates into a fragile deteriorating economy. In addition it’s now a fully mature expansion vulnerable to shocks. The FEDs incessant QE was an attempt to stimulate demand which would come from the future effectively pulling future consumption into the present. This pent up demand is now exhausted, here are some of the elements of this demand:
Apartment construction– Low interest rates stimulated a 6 year boom. Rents are now falling due to excess supply.
Autos– Boom in new car sales from lowering credit standards. Cycle extended by stretching the duration of auto loans. Dealers now choking on overflowing lots. (drive by your local dealer and take a look for
yourself)
Retail facilities– Glut of retail space. REITs abandoning properties with no end use. Office space vacancy rising.
Personal savings rates– Down to 5.4%, 100 year average is 8.5% Today’s level is typical rate before entering recession. The real numbers are likely worse since the top 10% skews the numbers. The bottom 3/5 likely have a negative savings rate.
GDP Growth at Stall Speed– Stated nominal growth is 2.9%. If Inflation is 2% then real growth is 0.9%. The Atlanta FED just forecasted first Qtr growth at 0.6%. The economy is like an A/C in a high pitch level and at slow speed. Any shock is the equivalent of pulling the throttles back to idle.
Economic Initial Conditions
To get a sense of the level of risk the economy is in it’s helpful to review the initial conditions the economy is in relative to past recession entry points. Different starting points produce different outcomes. Stated differently, someone entering a crisis with no debt and a good savings cushion will fare much better than one entering it in debt and living paycheck to paycheck. Our economy is no different.
Debt– Total debt-375% of GDP in 2016. This compares to 251% of GDP in 2006. Today is the highest level of debt at the start of a tightening cycle since 1870. When debt becomes increasingly non-productive bad things happen.
Economic Growth– 2016 had 2.9% nominal growth the weakest since 2009. This rate is even lower than the cyclical lows at the bottom of the 1990 and 2000 recessions. Despite growth being the lowest since 2009 no stimulus is expected in 2017, in contrast monetary restraint will increase. Remember tightening monetary conditions has special meaning in a highly levered economy.
Demographics– Rate of household formation is the lowest since 1936. The US has a rapidly aging society. Weak demographics reflect weak growth.
Productivity– The last 6 years has been the lowest rate of productivity growth in our history, a measly 0.5% a year. We have had a lack of productivity growth for so long that it has deferred household formation and exasperated the above mentioned demographics.
So the above initial conditions show the economy much less able to absorb an economic shock than the state of the economy at the start of other recessions.
Monetary aggregates no longer supporting a continued expansion.
Translation- economic speak for we have hit a wall. This is now occurring for two main reasons. First, rising interest rates are now reducing the demand for credit and in a fiat based economy one needs credit growth not to contract. Credit growth is now slower than the entry point for the past seven recessions. Secondly, regulations have increased the liquidity coverage ratio (LCR) for banks. This results in banks having to maintain a higher amount of reserves which results in banks lending practices being restrained. The FED’s three small rate hikes has likely turned the credit creation process negative.
When we lift the hood and take a look at the engine of the economy it’s in far worse condition than what the FED has told us. We are at stall speed, with credit getting more expensive and tighter. With the most highly levered economy ever we are far more vulnerable than at any other time of entering a recession. The economy is susceptible to a shock and the FED has adopted a very risky strategy of hiking rates into a slowing economy- What could possibly go wrong?
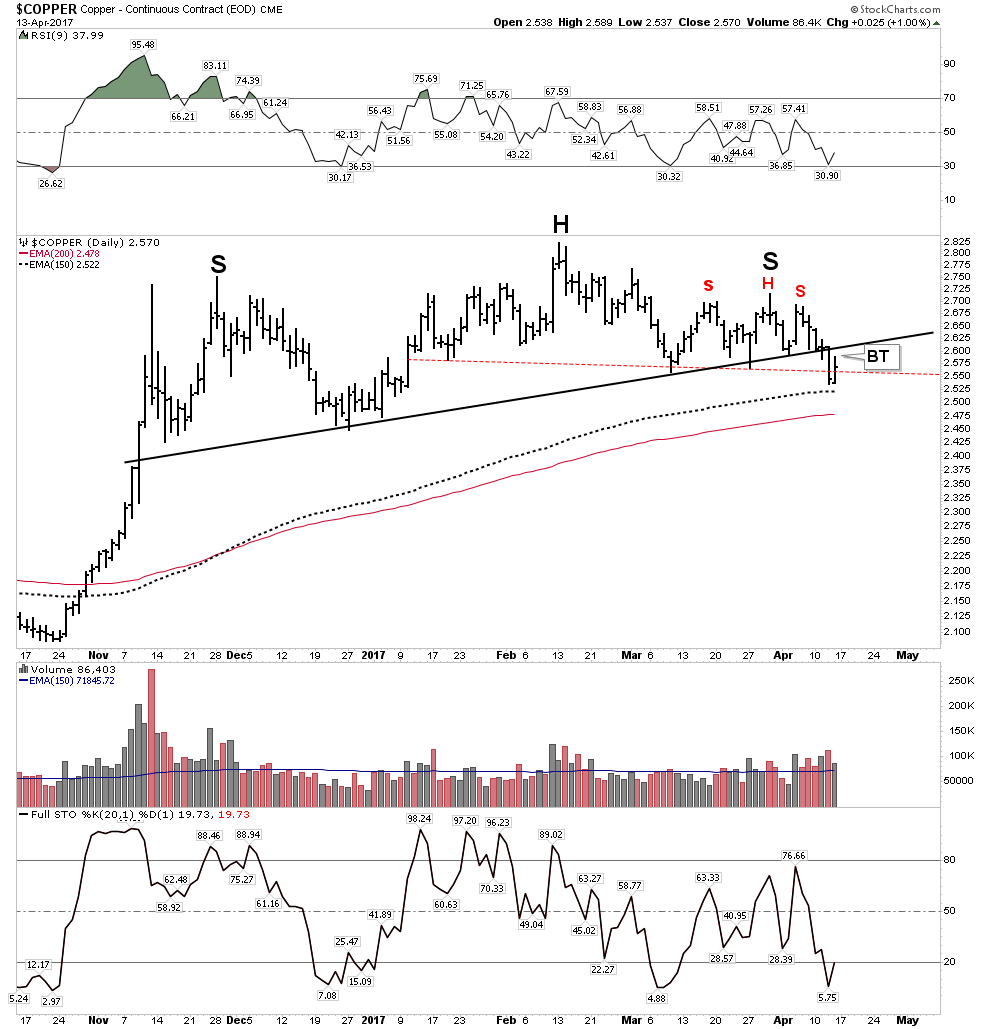
Before I introduce the Big Trade let’s take a look at Dr. Copper’s view of how the economy is doing. The below daily chart has put in a topping H&S pattern. It just dropped through its NL 2 days ago without anyone noticing and is now in back test mode. IMO this chart is announcing things are not all that rosy after all and the economy is slowing. Maybe it’s saying the infrastructure play won’t be the show stopper everyone hopes it will be.
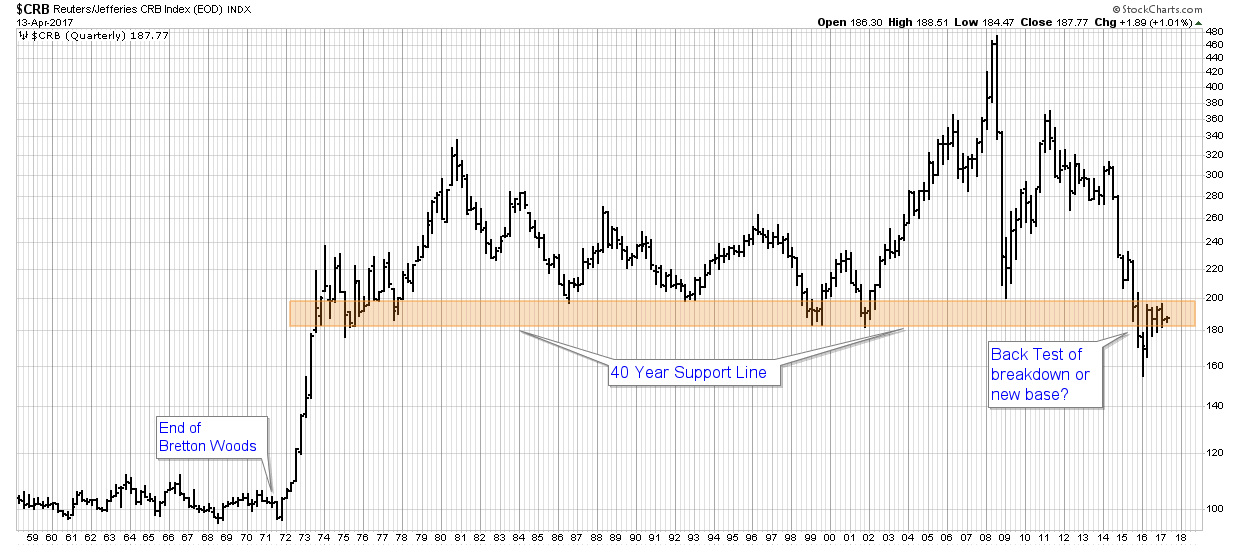
Finally I am posting two super long term charts of copper and the CRB. View these charts through the lens of price increases being driven by central bank credit creation. Then think of our existing economy as an A/C approaching stall speed. The nose is at a high angle of attack representing high debt levels and a credit contraction represents yanking the throttles to idle. With this visual picture in mind where do you think the ultimate price objective is on these two charts?

Stay Tuned to this Channel for Part III Plungers Big Trade.
economy dosent matter–the elite have arranged it so the public has nowhere else to go except the stodk mkt
joe granville-
‘what have fundamentals got to do with the stock mkt?!—NOTHING!!”
only the lower qoute was granvlles
Thanks Sir Plunger. I am on the edge of my seat!
Your exposition is both lucid and very timely. I realize the tremendous effort that goes into each essay and I’m very grateful. I’m excited about Part Three!
Thanks again
Stop teasing 🙂
Thanks for all the work that is going into these posts.
When the tide rolls back, everything are exposed. We have seen this at least once, some four times. Everything retrace, some more severe. We know what to do. When in doubt be conservative.