DXY Cycle and EW Analysis
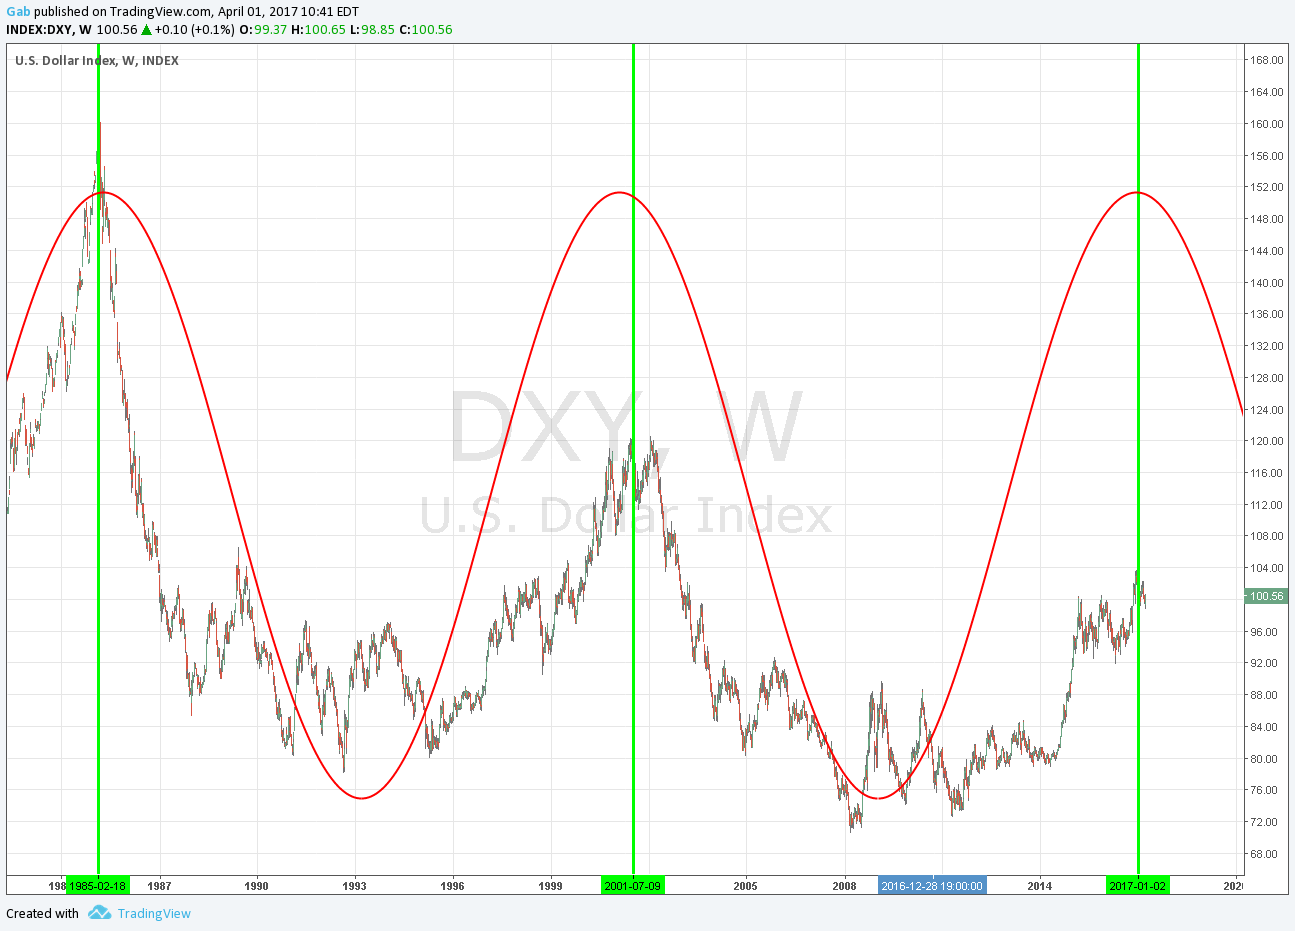
Looking at the cycle of DXY, we can clearly see the topping process of this 15-16 years cycle.
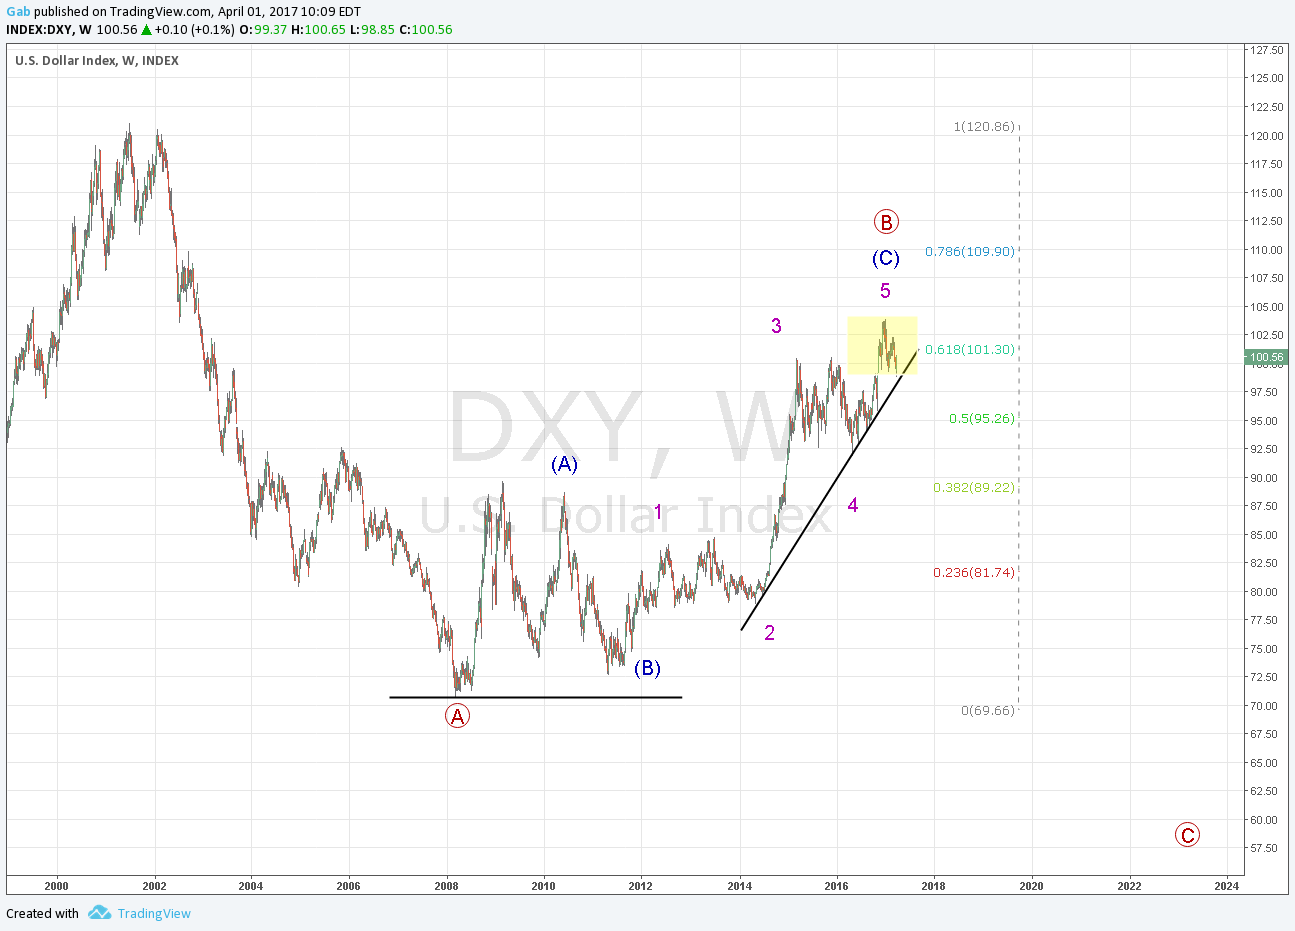
The first chart (weekly) is showing the Fib. retracement from the wave down that started in 2001 to the bottom in 2008
and the rejection right at the 61.8%. The structure appears to be a perfect zig-zag (a-b-c).
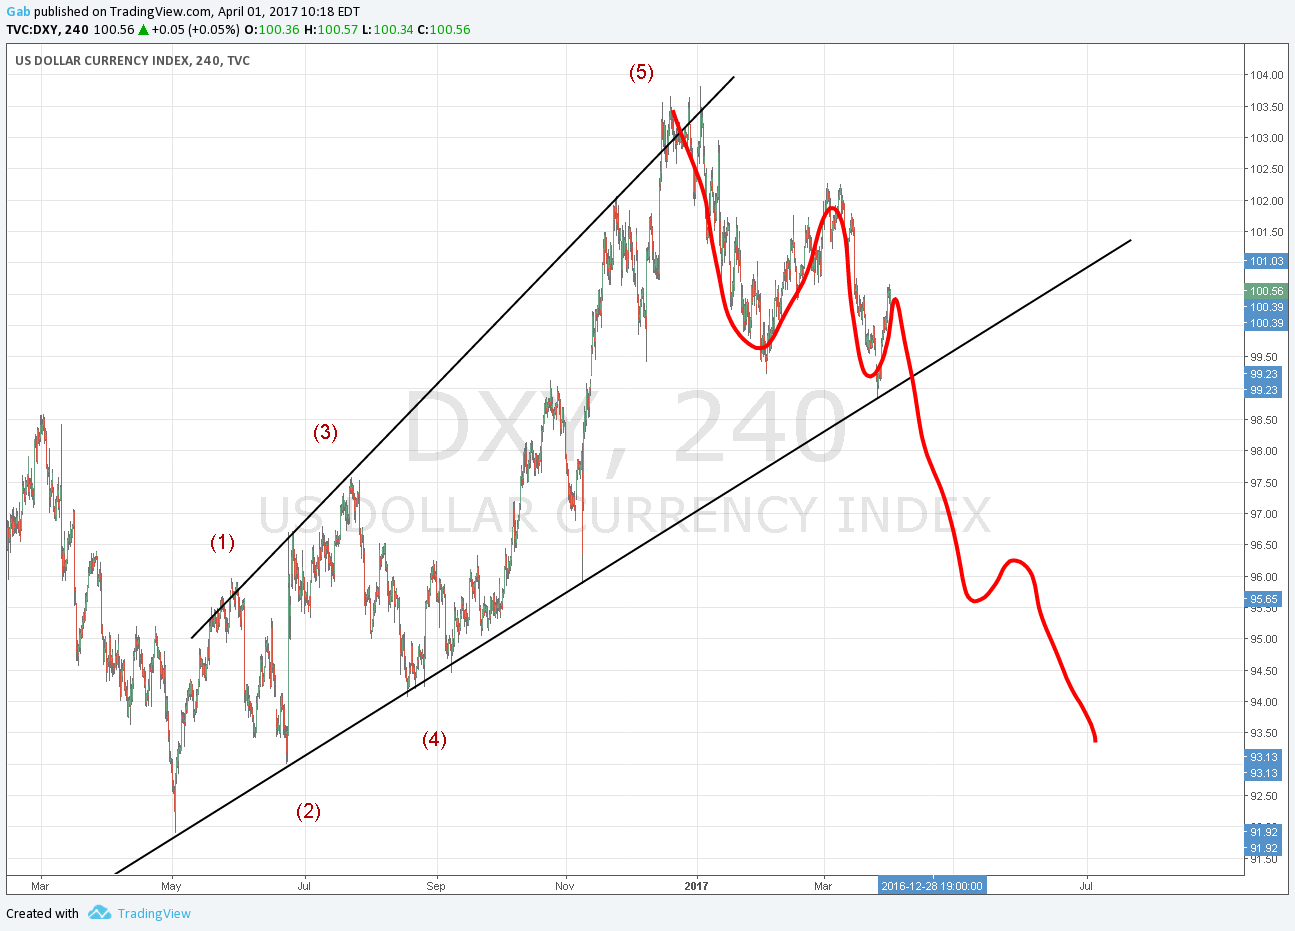
The other chart (4hr) shows an expanding wedge with an impulsive wave to the downside.
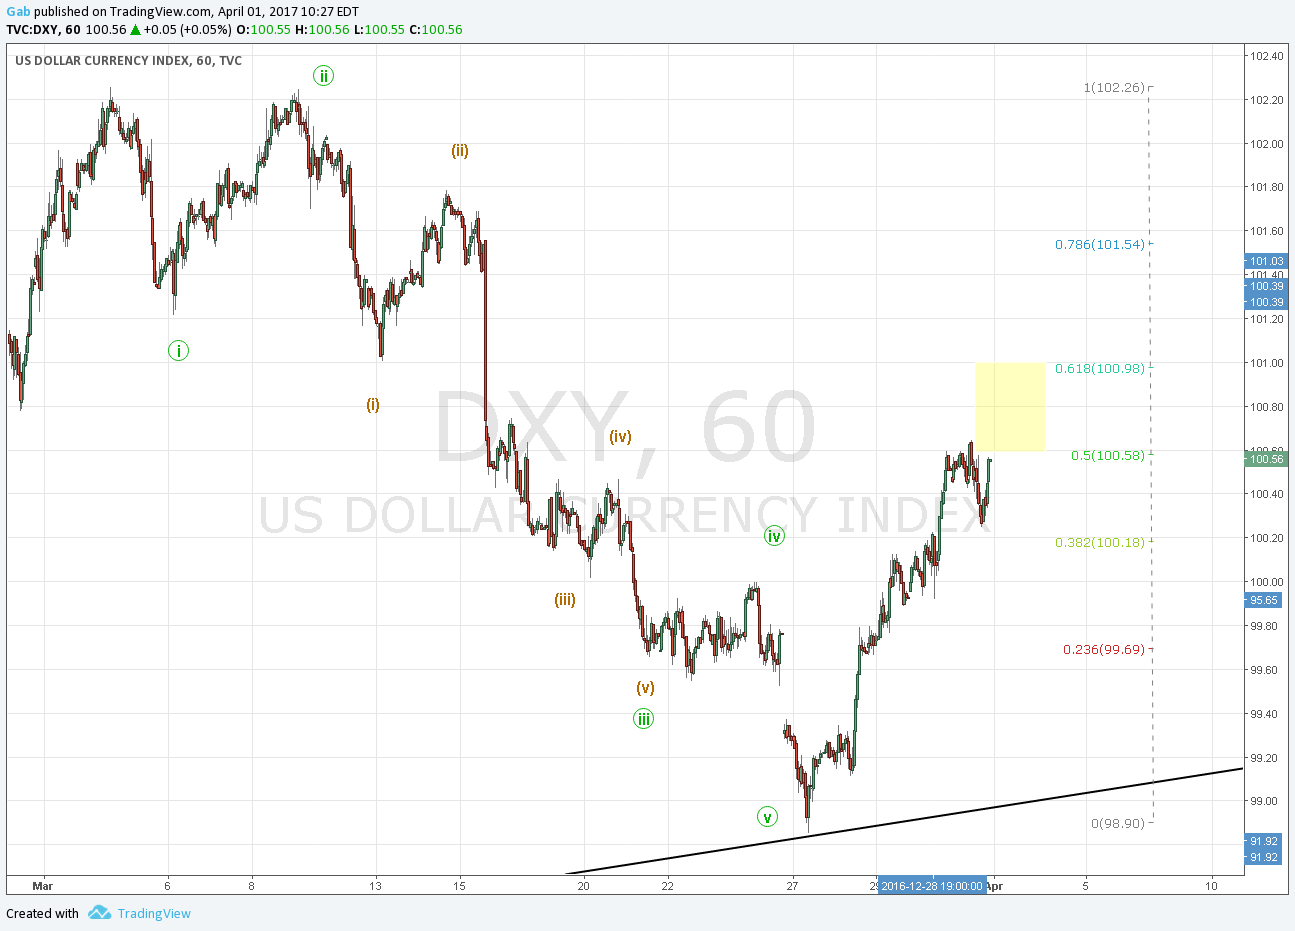
Finally, the last chart shows the last impulsive wave with the pullback approaching an important resistance.
Some converging data pointing for a very bearish market coming for the dollar in the near future.
Can you take the $USD data back farther? Usually pretty easy to make things fit two cycles – much tougher to make it fit eight or nine. (Statistics – degrees of freedom)
Cycles don’t lie. Take down time!