GDXJ
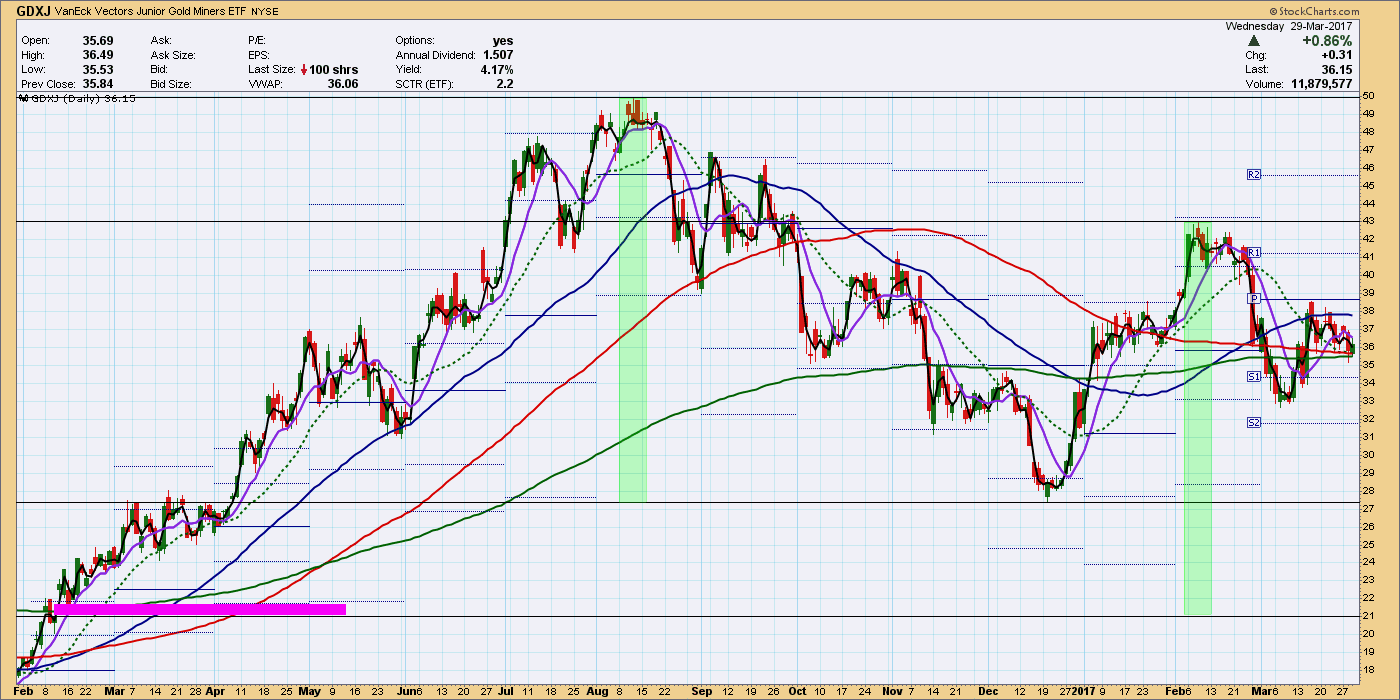
This is a first for posting a chart so I hope it turns out. Looking long term, wondering if this could happen. The move from the August high of 50 down to the December low of 28 is 22. A 100% measured move from February’s high of 43 would take it down to 21 where there is still a large gap. The daily 50MA is starting to turn down and the 100MA on the 2hr chart is already moving in a pretty good downward direction. Once these get going, they don’t usually make a quick turn in the other direction. Doesn’t mean that price can’t move above these MA’s but I think good to pay attention to. I’ve been playing with only MA’s on a separate chart and it called the August high and the December low, on the nose. It didn’t call this last February high but made a notification shortly after the December low that this last was a correction to what is still a bear market. I’m not posting this chart because it doesn’t really make sense why it works but I am curious to see how accurate it might be in the future. It’s quite possible that it’s a fluke. 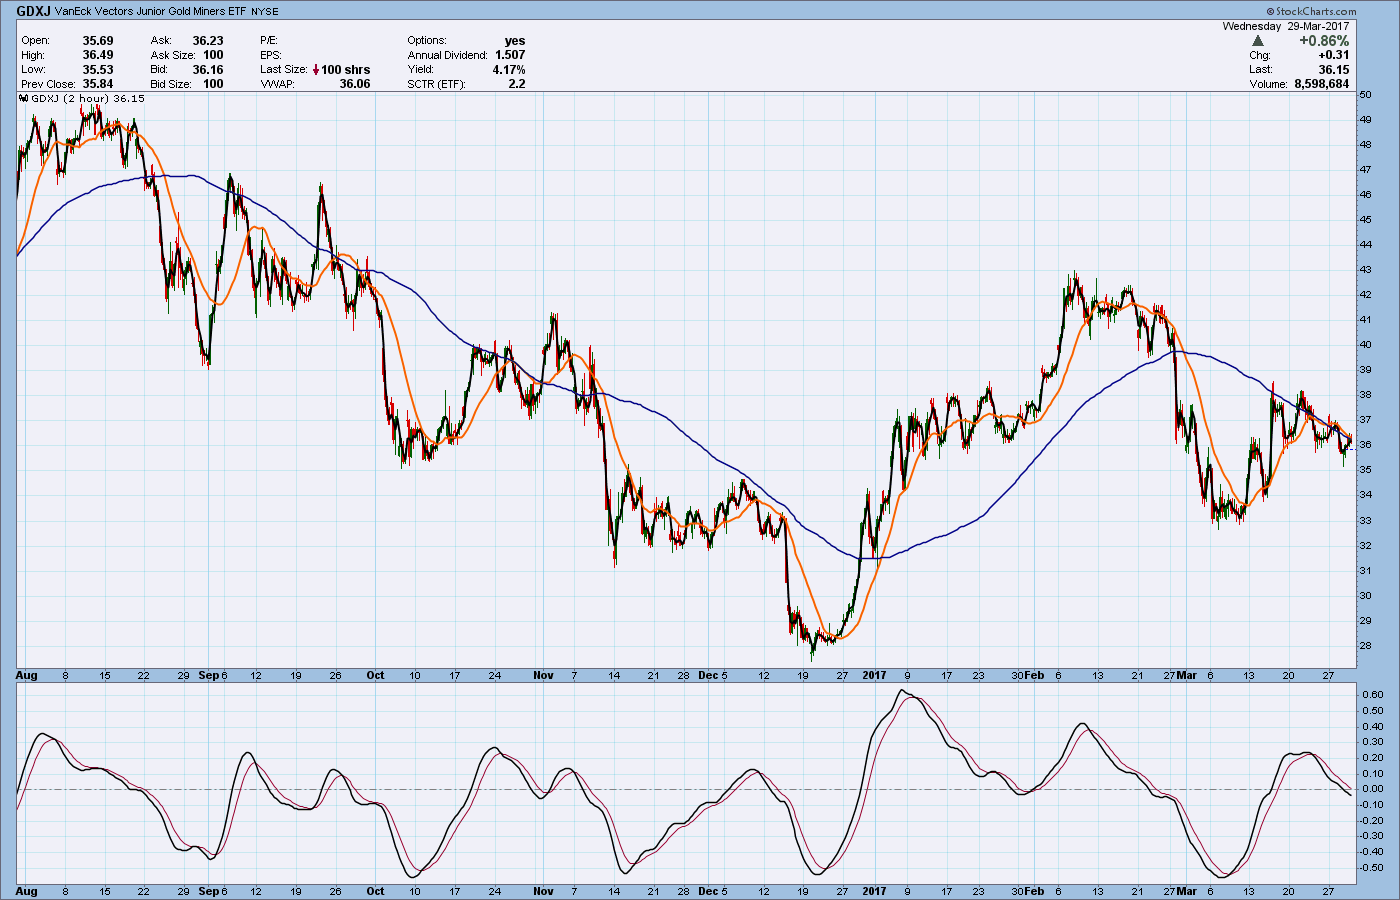
Welcome Swami.
Great Charts…congrats you posted your charts.
keep us appraised on this please…looks promissing
Thanks Swamimeister!
Could you provide some labels for your MA for better clarification.
The 2hr chart MA’s are 2,20 and 100 with a regular TRIX of 15,9. The Daily MA’s are 2,9,20,50,100,250. I tend to trade more by the 2hr chart than I do the daily. I wouldn’t buy and hold bearish miners based on this. Only a possibility.