Dollar Down, Gold Up. What Next ?
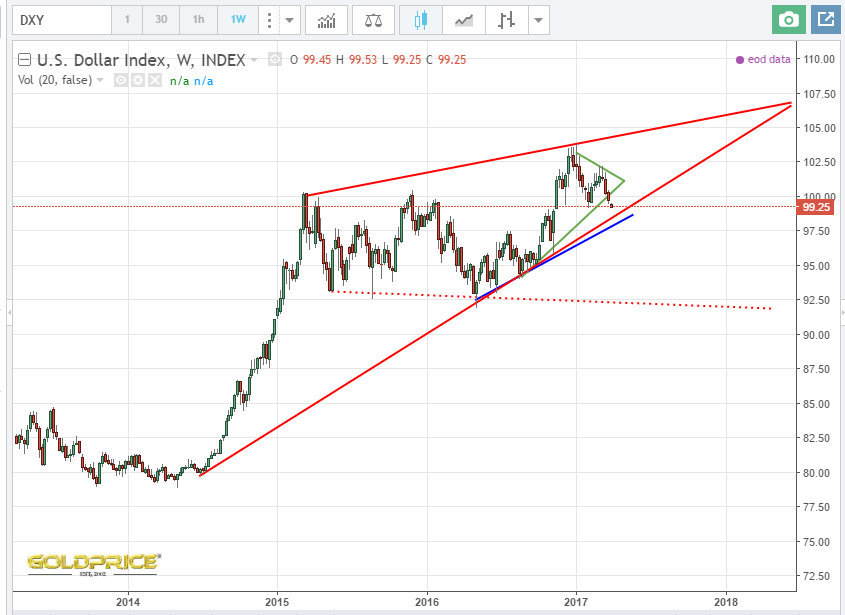
As per Graddhys expectations (and excellent charts/posts) things are panning out quite nicely for us. The dollar has dropped out of its triangle (shown in green). The bottom rail of the much longer term symmetrical triangle comes in at around 98.4 (depending on how you draw it, and whether you draw to the ‘spikes’ or not). There is secondary support just above 97 if you use the blue rail drawn from the 2016 lows. If that fails (and isn’t re-taken quickly) things get very nasty for the dollar. The symmetrical triangle (usually bullish) is negated, and the bearish megaphone pattern with the bottom rail shown by the dotted red line comes into play at around 92. If that goes, we are likely to retrace the entire move since 2014 and return to somewhere around 80.
The gold chart is approaching a very important point too…

Happy trading, and hold onto your hats 😉
USD down, gold and silver up, yet pathetic performance from miners….Not convinced of the move?
HUI is up 2.5% as I write. That’s not too bad. I know what you mean though, they have been lagging lately – not necessarily a problem, as long as the charts show a good set up. The HUI is back above its 50 day moving average. Daily chart just showed a bullish TRIX crossover. We’re also above the 200 week moving average again. A move above the 50 week moving average at 217 would be super-bullish. So far so good I would say. Of course, anything can change at any time.