‘The Pattern’ still in play…
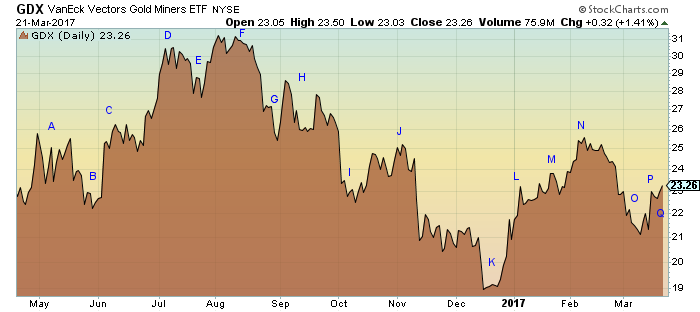
Current GDX Chart:
Reference chart (Nasdaq 2000-2003):
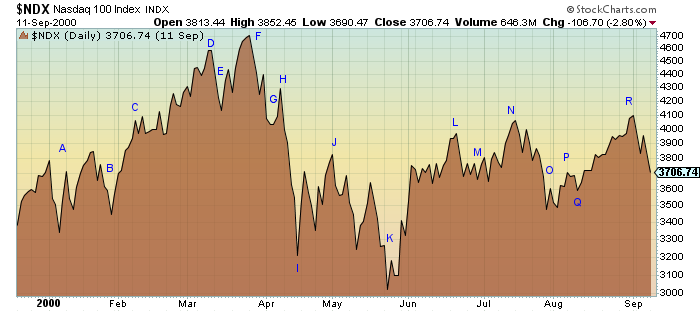
Still following nicely. GDXJ showed a much larger decline into point ‘Q’ than GDX did, but since I started with GDX I will continue with it. I expect a 2-4 week rally that will take GDX up to 26 (point ‘R’) then start a comparable decline to Nasdaq 2000-2003. I know, nobody believes it could happen.
I have tracked this specific pattern across many different types of stocks at multiple time frames and it has proven itself a reliable indicator. I am following this with a large chunk of my money until such a time as it breaks away from the reference pattern (Nasdaq 2000-2003). I will try and post weekly on it’s progress.
What’s the pattern tho or should I say it’s methodology ? Ty
I don’t really know. I have just seen this particular pattern over and over and it almost always seems to play out the same way. The shorter time frames (minutes instead of days) don’t usually drop as far as the daily patterns (the drop after point ‘R’) but in all cases, once it hits bottom, it really shoots back up again (think Nasdaq 2000-2003 drop, then the increase up 2003-2008).
I see the same sort of thing happening but using different tools, posted about a month ago. Will be interesting to watch.
https://invst.ly/3avdz
Very interesting. My PO, if it were to play out percentage for percentage with the Nasdaq crash, would be GDX 5. That sounds pretty crazy to me, but you are showing about the same decline. Amazing.
The first chart on this thread that I posted seems to line up with your 2 to 4 week rally. https://bradleysiderograph.com/2017-turn-dates-gold/