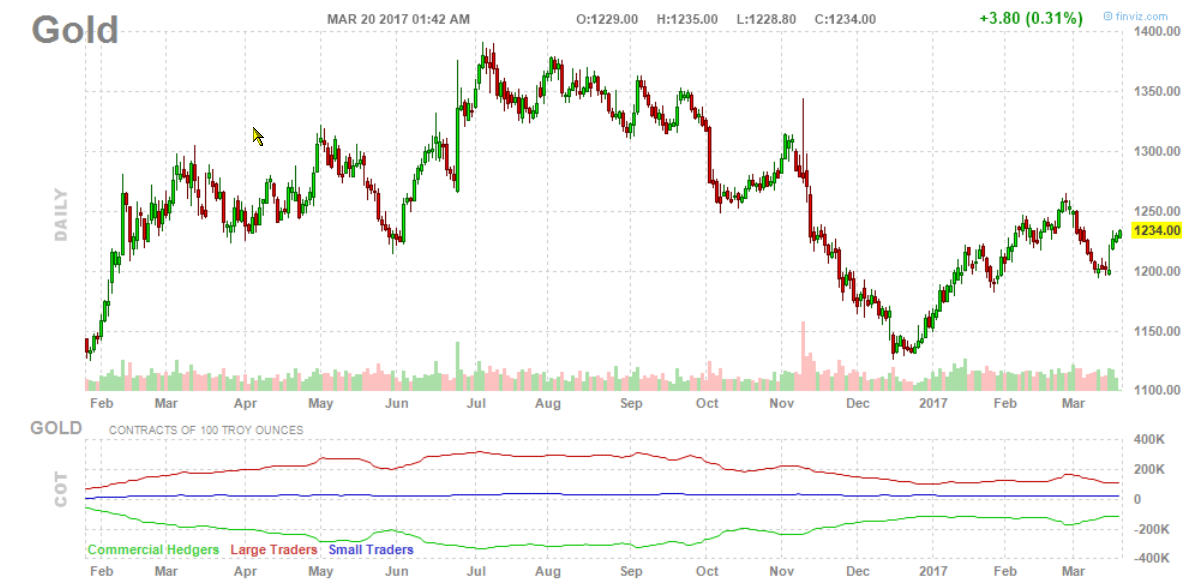
Where have the speculators gone?
It would appear to this novice’s untrained eye that this chart indicates there is less speculation (aka hot money) at this higher low in GOLD. Also compare today’s COT to June of ’16 (relative to gold spot). Fuel for bulls? I realize there is a delay in COT figures but the trend is there. If I’m not reading this right, please comment. Thanks.
Gold doesn’t look too bad, but look at silver. It is at a very high level of speculation.