Gold & $XJY Weekly & Monthly Charts Look Bearish For PM Space
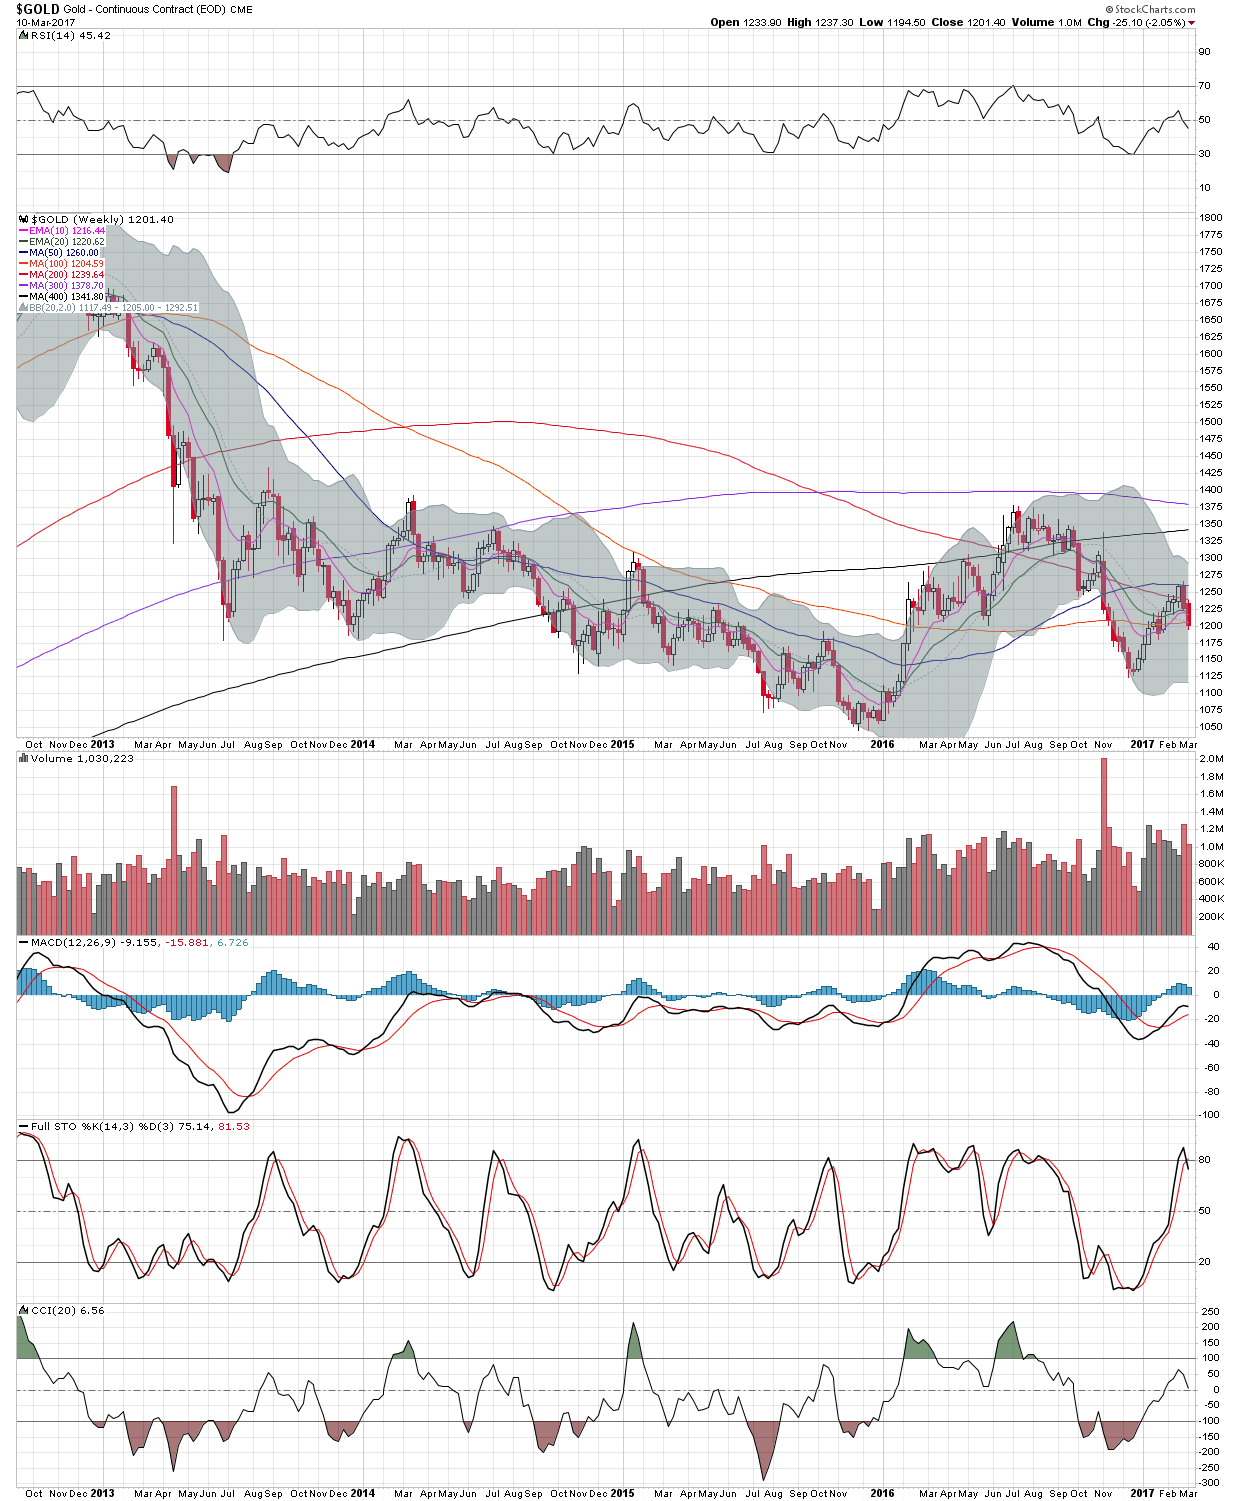
SMA 50 clearly acted as resistance, looks bearish IMO.

Price couldn’t get above the SMA 50 on the monthly either. My first thought when looking at the positions of
MACD, STO & CCI on the above chart is, “this chart sucks”, which is to say, bearish.
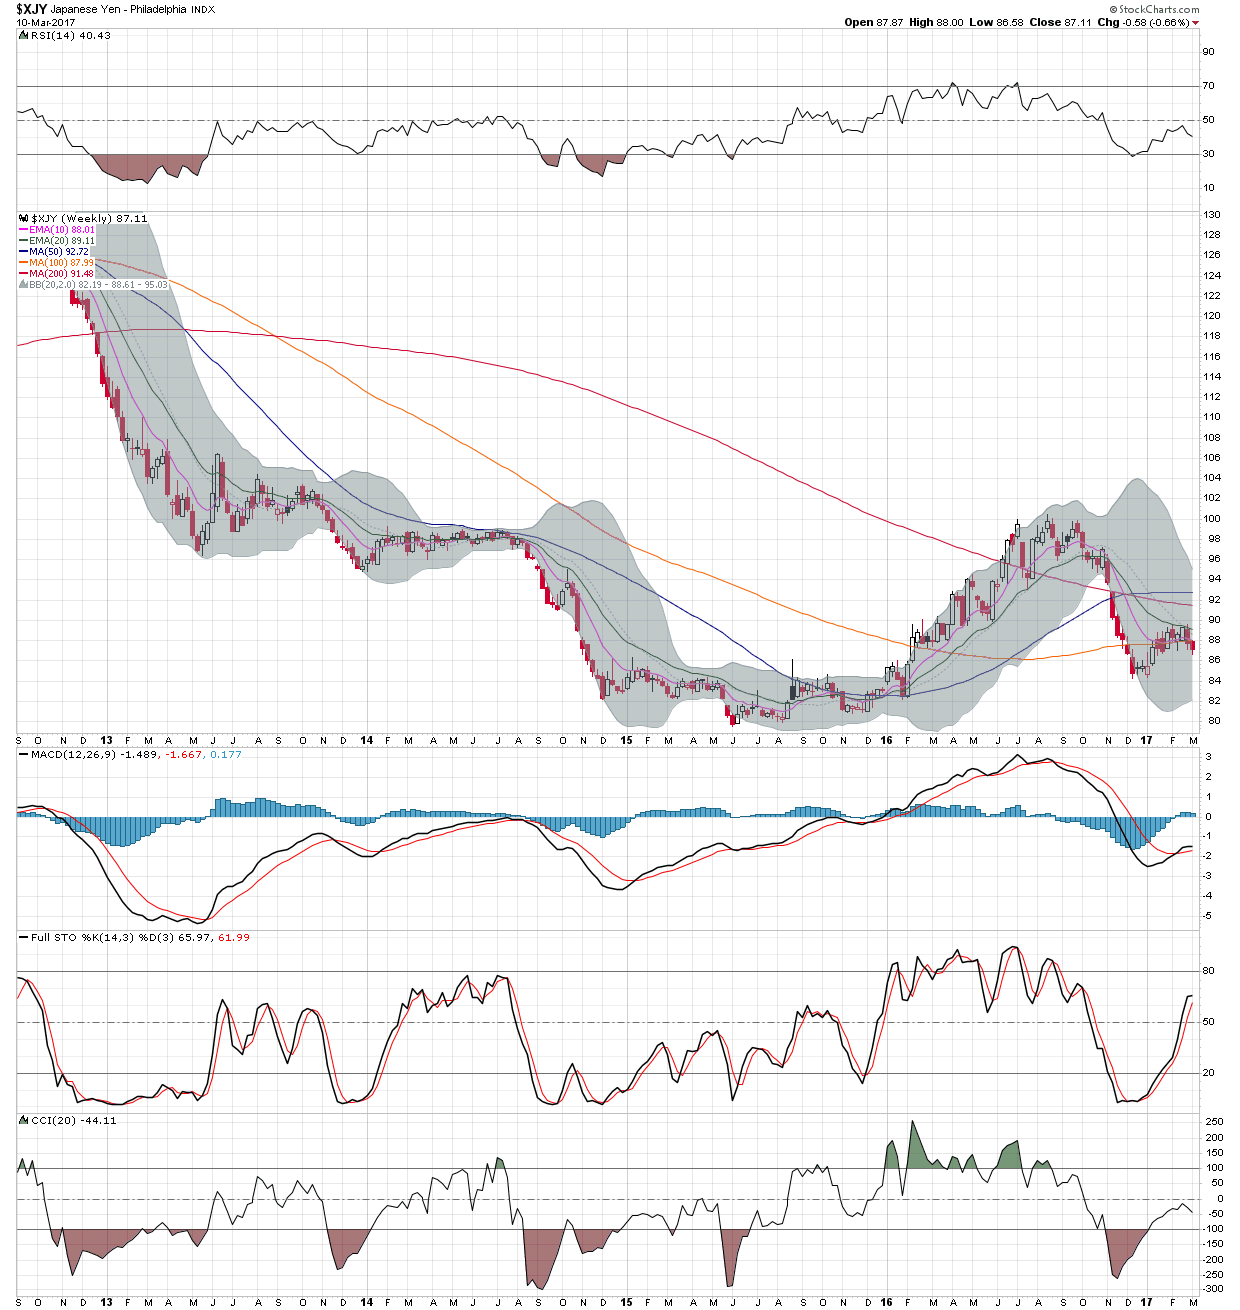
$XJY weekly hit resistance at the EMA 20.
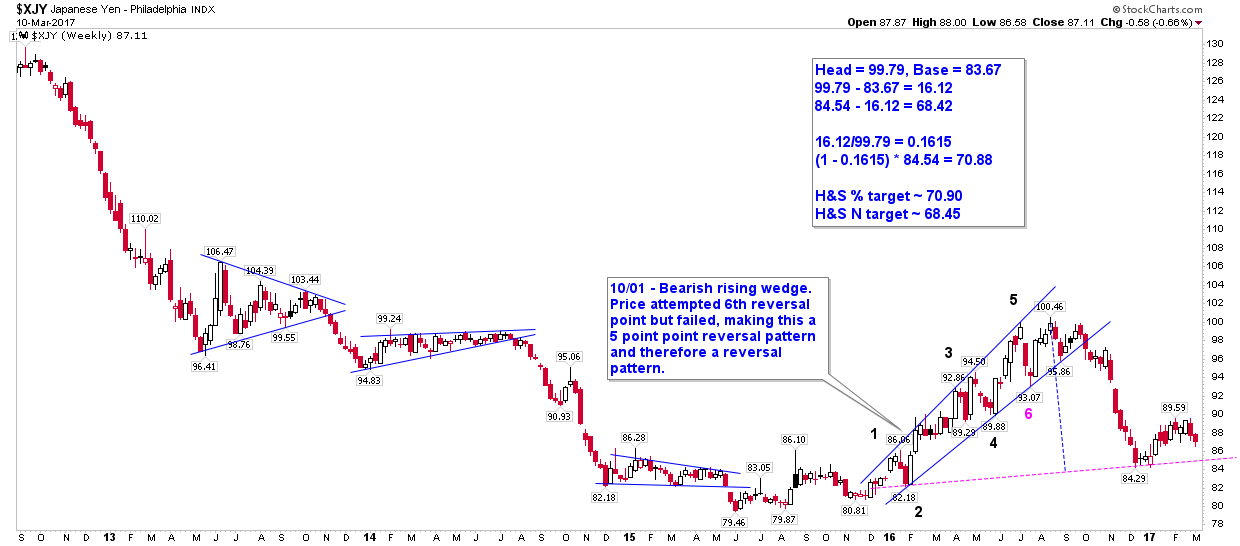
Possible H&S building on $XJY weekly too:
MACD, STO & CCI also suck on $XJY’s monthly chart IMO, which is bearish for the miners provided
the correlation between the two continues to hold.

I don’t pay as much attention to the markets as I used to and won’t moving forward owing to work commitments.
Friday’s reaction in the miners was, IMO, due to some hawkish noises coming out following the ECB’s latest
meeting together with them being due for a bounce. I’m assuming now the next question is whether Yellen
and the FOMC have a hawkish rise, dovish rise or neutral rise on Thursday but I hear rumblings of June
also possibly being “live” in terms of a further 25bps rise.
Bottom line, there’s nothing bullish about the above charts for the miners in the coming months as far as
I’m concerned. The next wildcards are probably going to be both the ECB and BoJ making noises about
tightening their monetary policy too. If the USD is rising strongly, Europe and Japan will be
pressured by the US to strengthen their currencies, particularly with The Donald & Co in charge, and I expect
them to play ball.
GLTA
Thanks JL, in my limited experience the rounded price structure in the Yen weekly chart very rarely exert themselves to the upside.