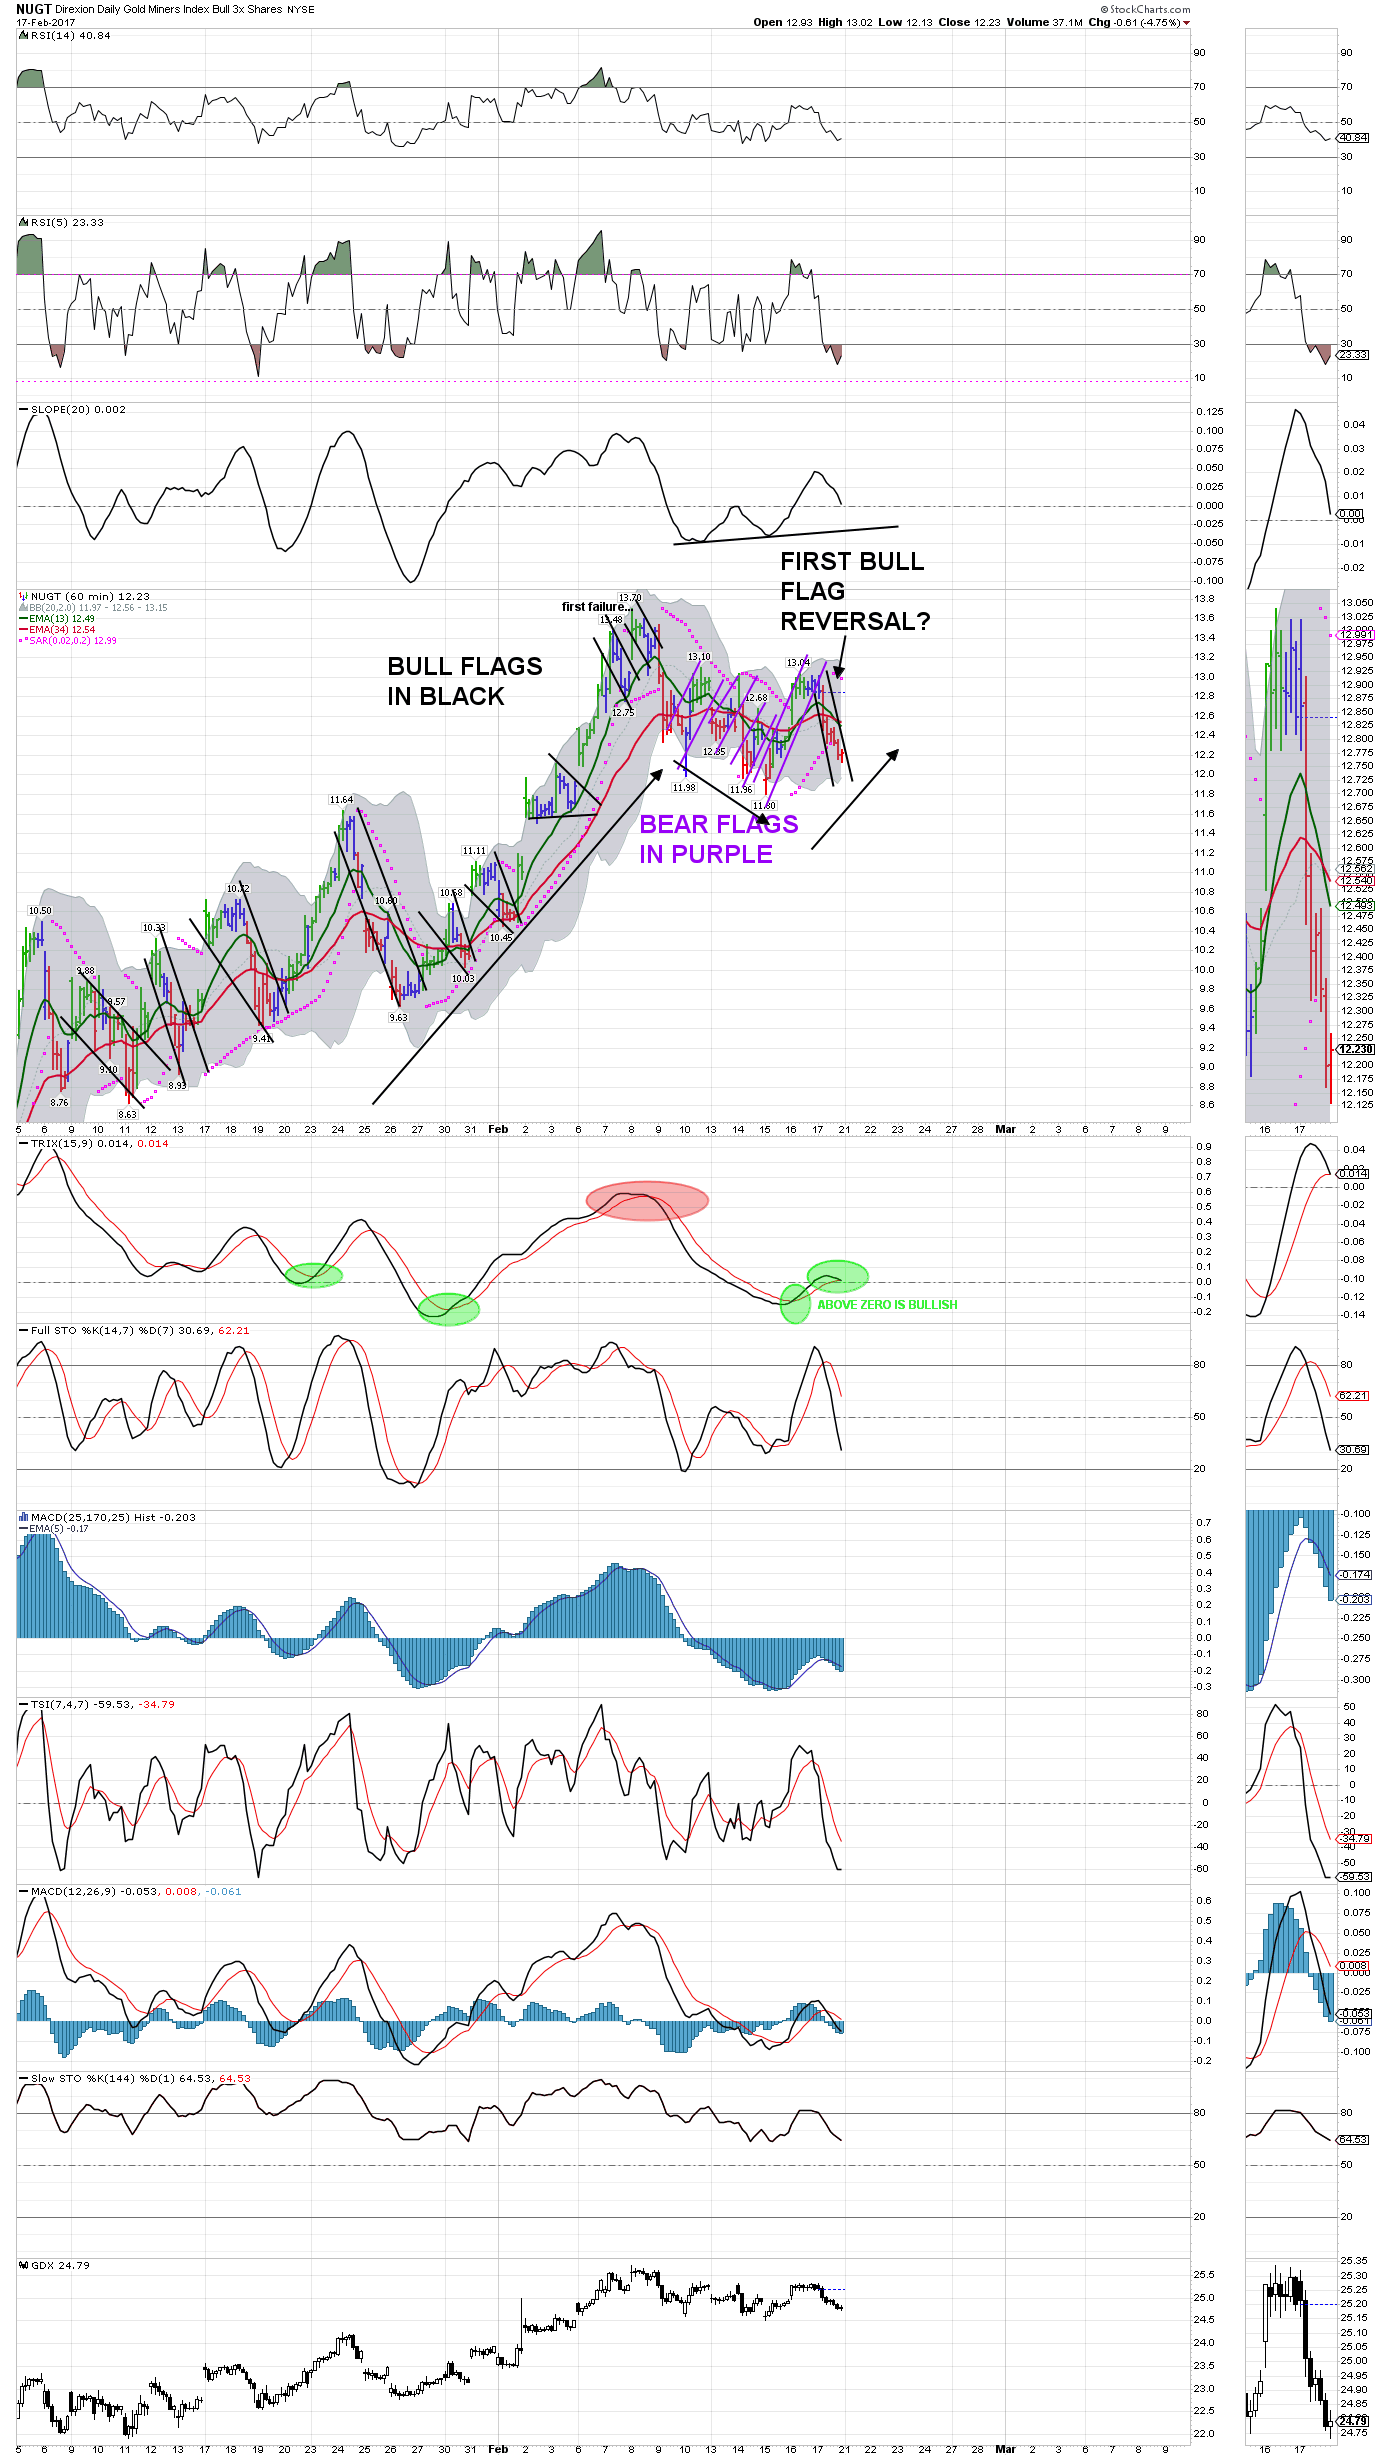
BULL and BEAR NUGT 60 Minute Chart…
Nightingale and myself both posted GDXJ and GDX charts hitting trend line support…
GDX daily did have a bearish engulfing pattern on Friday (not the best example, but one nonetheless); However, the price action remains above the bullish 13 EMA level…
Was Friday our first BULL flag after a series of BEAR flags?
GDX “Trend Change” Chart is denoting a BULLISH change in momentum at the daily level…
This is my “go to, all is clear” momentum chart…
AND a clear consolidation OVER the 38% fib sure looks BULLISH…
I wait for a BULL signal on my 15 minute chart…

Fabulous charts Eagle! Thanks for sharing.
Don’t always reply….but always look for your work
Appreciate your skill and talent here
Thank you
The only thing is that HUI, GDX, AUX all broke their trendlines. HUI, GDX had perfect backtests of the trend line on Thursday/Friday. GDXJ is currently right on its trend line but it should follow the others. I’m looking for another few day of downside before resumed up trend. Silver also wedging.
“looking for another few days of downside before resumed up trend.”
Same … but the uptrend resumption may also be relatively brief … several weeks perhaps … before it ends.