Gold vs the USD- somethings got to give- and soon.
We have all been watching the USD vs gold as they have been moving opposite one another. Trying to get clues as to which way they are going to go as this seems to be defining the move. So let’s take a different look at the same thing through different eyes.
Let’s first invert the USD so it should be moving with gold and see how they look. Yep, pretty high correlation and they have been moving in lock step with one another. Just like we would think it should. But what is this? Since Feb 1 they have suddenly diverged with each other, which means they actually have been moving together if you look at the raw charts. Why? I would suggest two things. One is we have reached that point where gold and the USD actually can run together, or its just a divergence stretching the rubber band and it will eventually snap back. The second outcome is my preferred analysis.
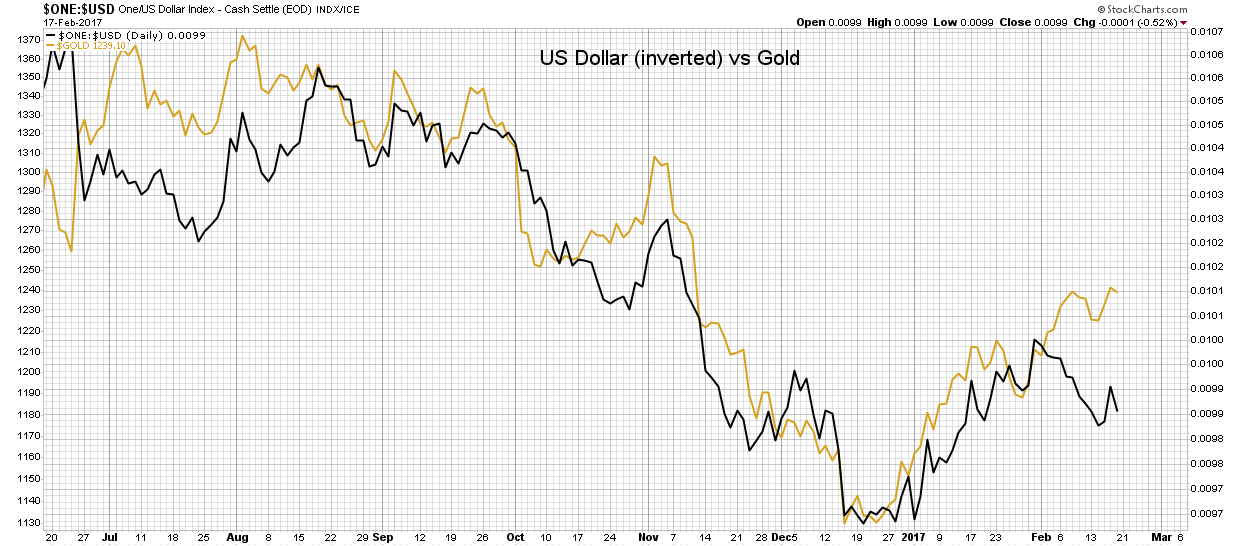
So what’s going to make these track together again? which one up and which one down? Let’s look at the raw charts.
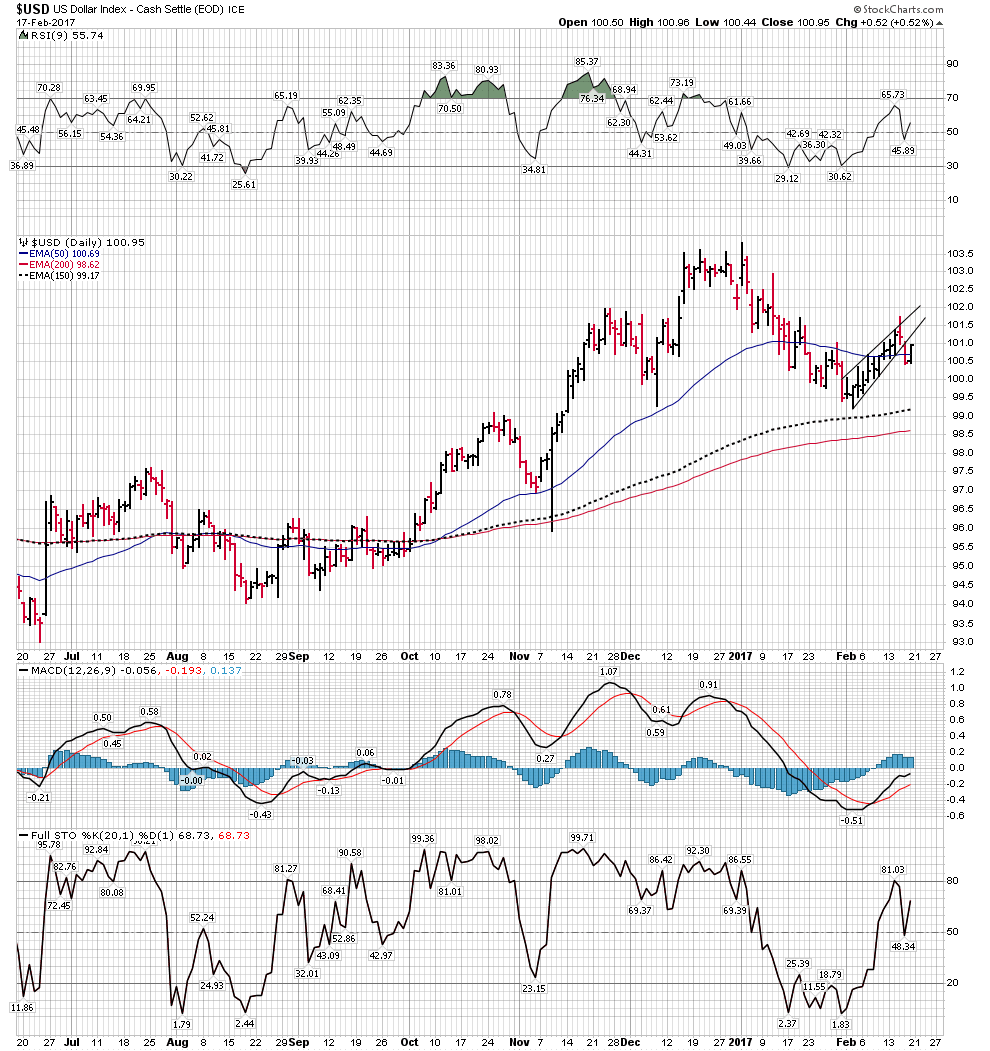
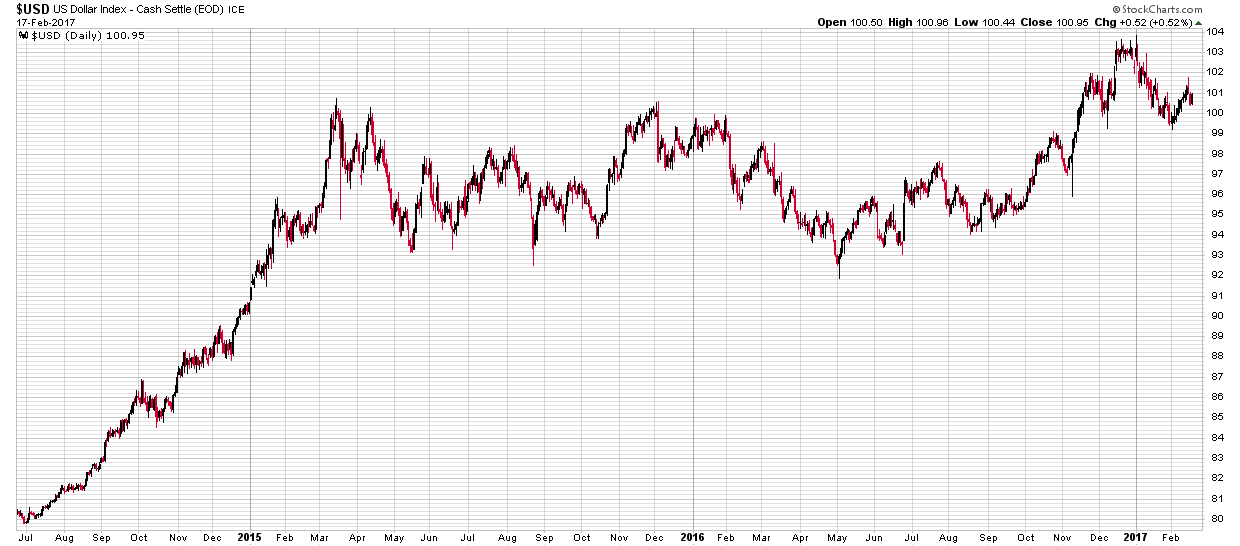
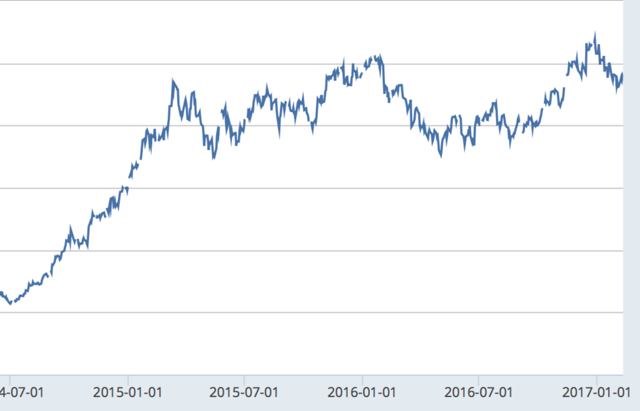
Let’s first discuss the USD. The longer term charts depict it is undergoing a hard back test to its 2-year consolidation. Ultimately its my view it will survive the backtest and resume its impulse upward, but that could still take some time to get underway, meanwhile it carves out a more complex bottom. It’s my view that this BT process takes more time and could play around with the 30 W EMA for a while bottoming in the 99 area. That could still take another 2-4 weeks or even more. So it looks like the recent rise was a simple bearish ascending wedge. It broke out of it to the downside and today was just a BT of that wedge. The 200 & 150 EMA should be supportive of a base. Those averages are not pointing downward, so its still healthy.
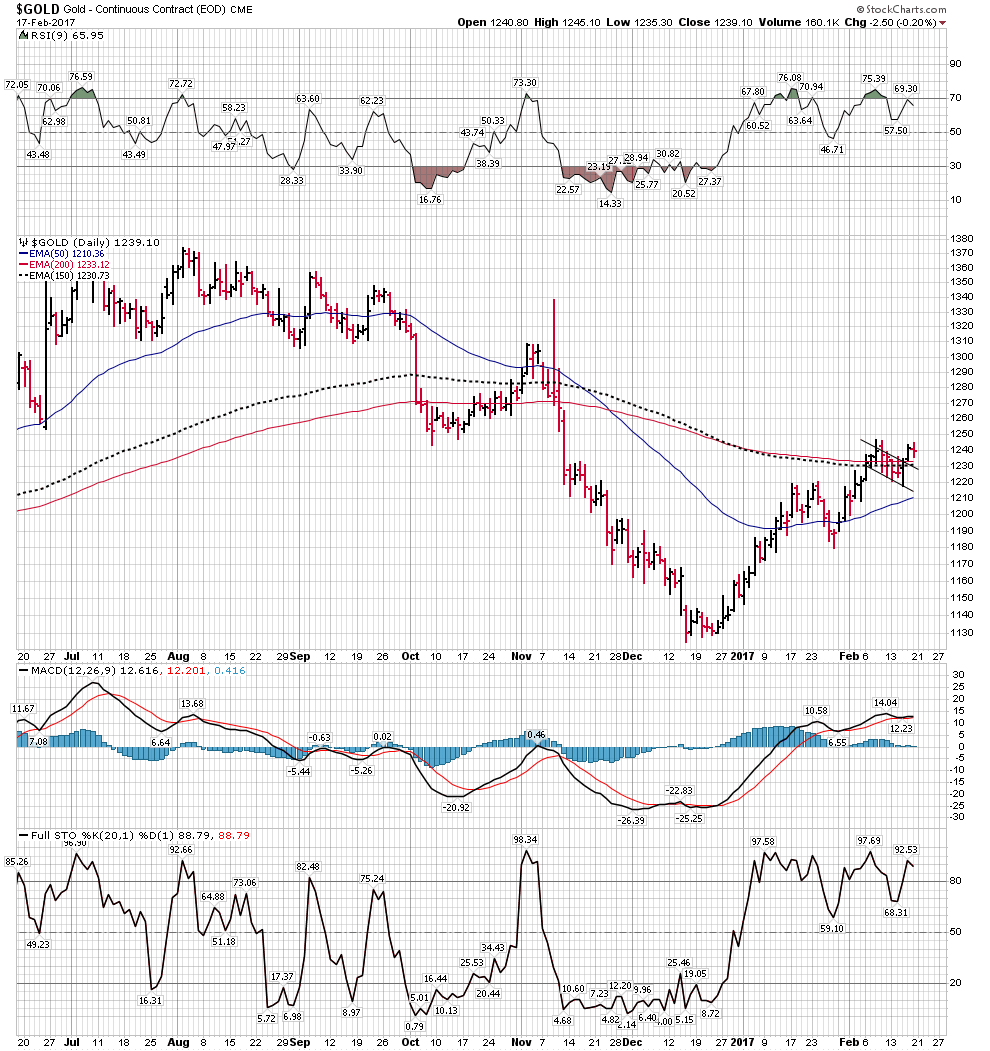
Looking at the gold chart we see what appears to be a bull flag right at the 200 & 150 EMA. We know that often we get patterns build out right above/below or on significant averages as they act as support or resistance. Both averages are in the process of turning slightly up. That’s favorable for a continued upward move. RSI looks good showing strong momentum, however note the last mini high at 69.30 is slightly lower from the last peak. We are going to want to keep out eye on that. One good day however could correct this, but it bears watching. Stochastics & MACD are fine.
Overall, the gold appears to have the bullish edge, but not by a lot. So let’s introduce another data point.
The Trade Weighted USD
This is a FED generated USD dollar measurement. It is different than the USD index as it is not just a relationship to other foreign currencies rates, but takes into consideration the amount of foreign trade volume within those currencies. In a perfect world a currencies value would be determined principally by the amount of trade a country does. So there is merit in observing it. It may offer a bit of insight into what’s ahead. I have written a lot about how a senior currency remains strong in a post bubble contraction and is a magnet for world capital. One should realize also that the USD is strong because of trade. Countries that trade with us need dollars and even trade with others requires dollars. All OPEC oil is invoiced in the USD. So protectionism is the talk and fear currently. This could lead to lower trade and a weaker USD. Be aware of it. So take a look at the trade weighted dollar vs. the USD index. They are very similar, however the trade weighted dollar is slightly weaker and now violating some of those levels we regard as so important.
So maybe its the USD dropping a bit which will bring back the inverted USD and gold to move together again. That would mean gold would rally from here.
Thanks for D heads up Capt. Meanwhile I am preparing to approx when to sell before wave 4 of 1. Last 2 of 1 had 8.4% 1366-1251, 6 Jul – 7 Oct, then a deeper 13.5% C 1303-1128, 9 Nov – 12 Dec.
Wave 1 of 1 had pullbacks 2.9%, 3% then 6.6%.
Fascinating stuff. Thanks Plunger. Talking about dollar trading… http://www.marketoracle.co.uk/Article58181.html
china is now buying most of its oil in yuan from russia and iran. the yuan paid is then converted to gold on the shanghai exchange. thats one reason its a physical exchange, not paper trading. opec is slowly losing its influence.
this is the real reason russia and iran are in the bad books. how dare they circumvent the usd.