$Gold – Daily
It’s possible that gold is about to embark upon a 21-day cycle that could see price accelerate to the $1,300 + level in pretty short order…
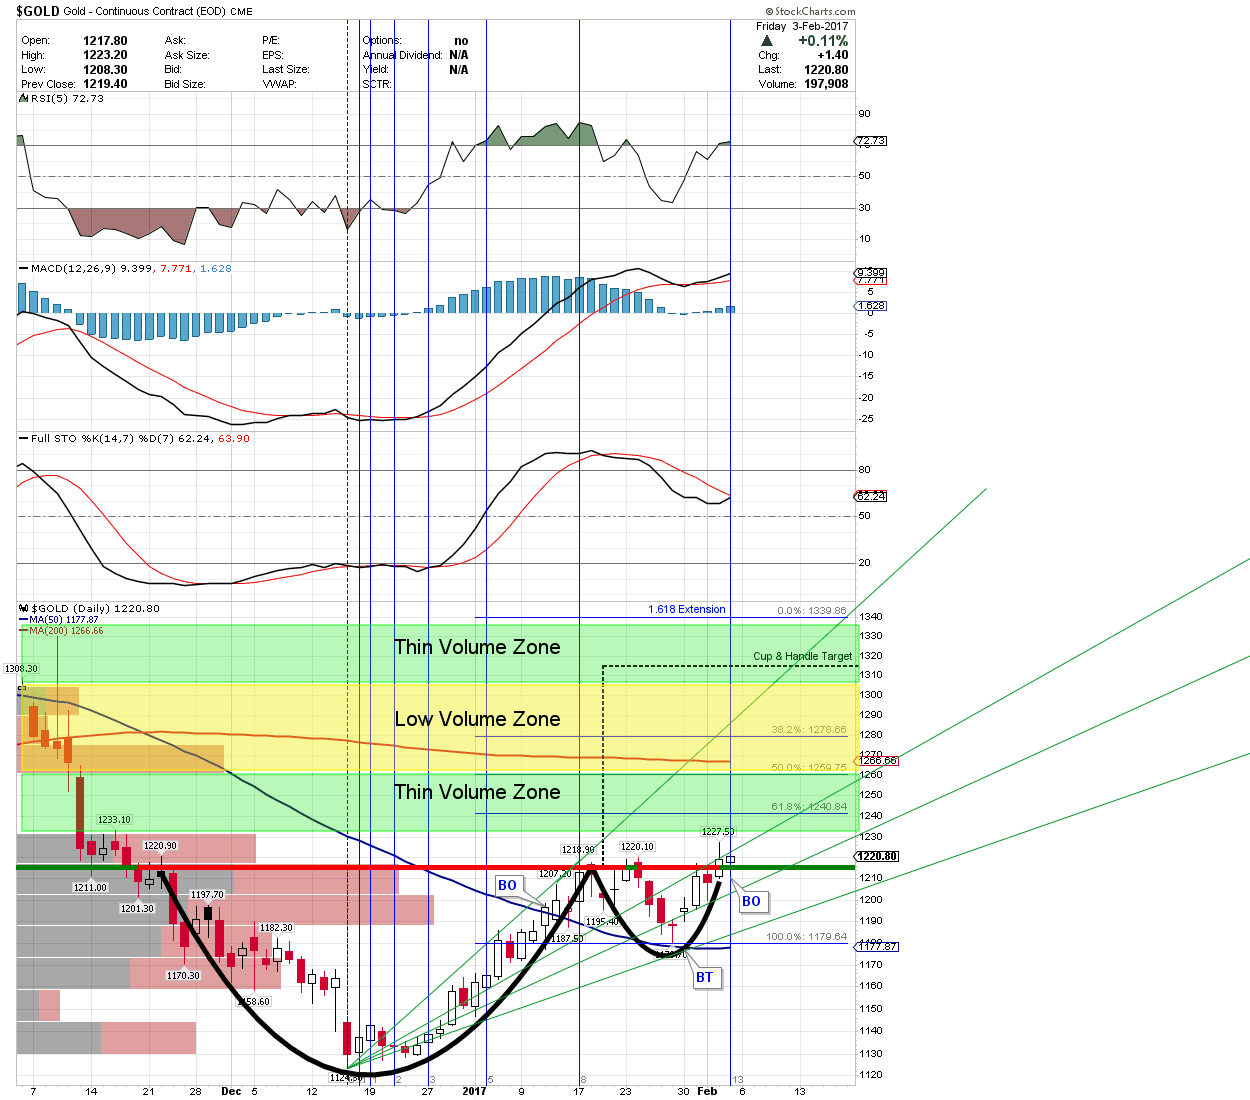
There’s a lot going on in the daily gold chart below, but hopefully not too much:
- Gold appears to have put in a major low in Dec, as evidenced by a breakout and back-test of its 50 day MA.
- Gold is now breaking out above what appears to be a bullish cup & handle formation on the last day of its most recent 13-day Fib time zone.
- A break above the (green) 38.2% fan line immediately overhead, or let’s say above $1,230 – would place gold within an extremely thin volume zone, where price could accelerate sharply.
- Other than moderate volume at the 200-day MA level, where moderate resistance could be mounted, the price zone up to $1,340 is characterized by extremely thin volume.
Nice RTV thanks
One fly in the ointment is Surfs Dollar Cycle. It’s over due for a Daily Cycle Low.
Rues wide open.
Armstrong says 1272 long-term sell signal, for what it’s worth.
Hi Marcusjames. What does that mean? That if gold reaches 1272, that will be long-term high and should be sold?
I think that is what he meant. It’s hard to nail Armstrong’s doublespeak.
“We can see how the array worked. Gold bottomed the week of December 12th and the the Panic Cycle and Directional Change sent gold higher. The next target was the week of January 16th, which did produce a high and then we say a one-week Knee-Jerk Reaction into the week of January 23rd and then there should have been a bounce into this week of the 30th.
Although we need a weekly closing on Friday above 1221, keep in mind that we are also generating a long-term sell signal at the 1272 level. This is warning we are not quite ready for a prime time bull run.
Our next important Directional Change will be April. We should be care around Friday April 21st.”
Thanks. I appreciate the follow-up. If I’d have based my investing/trading decisions in 2016 on the tidbits of MA shared here, my sense is, it would have been an awful year.