The Happiness Factor – A 5th Grader’s Forecast for US Employment 2017
Chart below show US Unemployment Rate for past 70 yrs.
Two parties involved – The Powers That Be (TPTB) and the eligible age US worker, we’ll call them STIFF’s – as in the working (or wish they were) type.
Demarcation Lines – For aurgument’s sake let’s call anything below 5% the Happiness Zone – TPTB and the STIFF’s are in harmony or at least not as concerned with one anothers’ business.
Shaded areas are apparent recessions (in hindsight).
The troughs are considered full or at least ‘acceptable’ employment, nearly all of which are in The Zone.
The uptrends are sharp and they nearly all have the same slope.
Downtrends while understandably not as steep, represent optimism/hope and rising confidence of the STIFF’s that TPTB are working toward their best interest. Failure to ameliorate this hope results in regime change and discomfort for TPTB – like anyone else, self interest is their bottom line.
Yea, nothing new here but I’m a 5th grader.
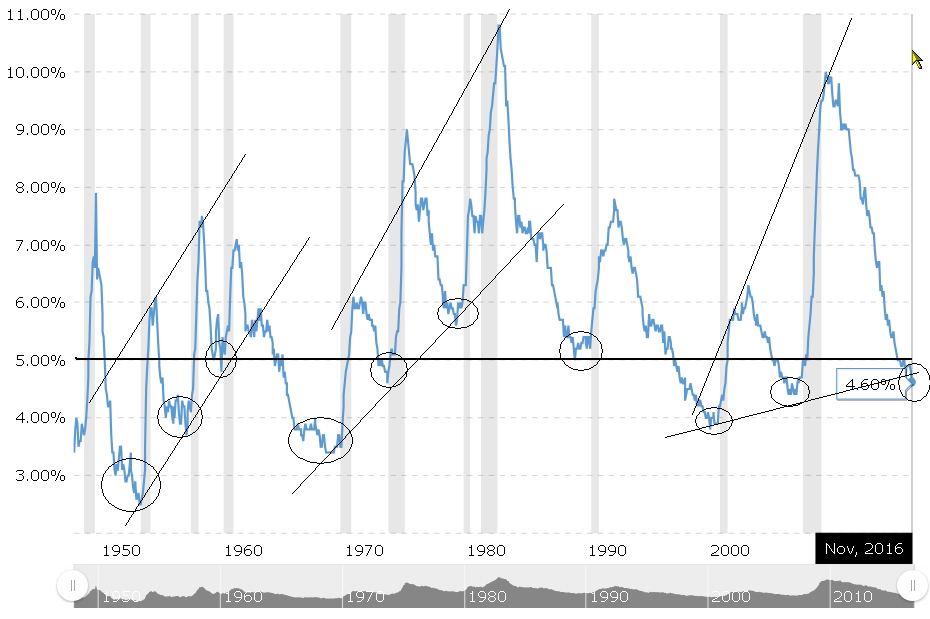
So here’s what I see as the most predictive thing about this chart – note the widening wedge patterns in the STIFF’s vs. TPTB cycles – 1950-1960 (3 ct) 1970-1980 (3 ct) and most recently 2000-Current (2 ct) – very symetrical. Then notice the downward slope behavior and duration of ‘peak employment’ at the bottom of the troughs – on a month-to-month basis (google macrotrends for interactive chart), they are somewhat rounded, lie in a tight % range, and only last anywhere from 12-24 months (once 36 months in the late 60’s).
It makes sense to me that the cycles come in higher-lows and higher-highs since the first attempt at ‘fixing’ whatever problem may be at hand (inflation, stagflation, tech bubble burst, debt crisis etc) turns out not to be an entirely successful, but one that gets the economy through the next election cycle or two.
The one striking thing is THE TROUGHS DON’T LAST – the battle between TPTB and the STIFF’s is as cyclical today as it was 70 yrs ago – sure as winter comes.
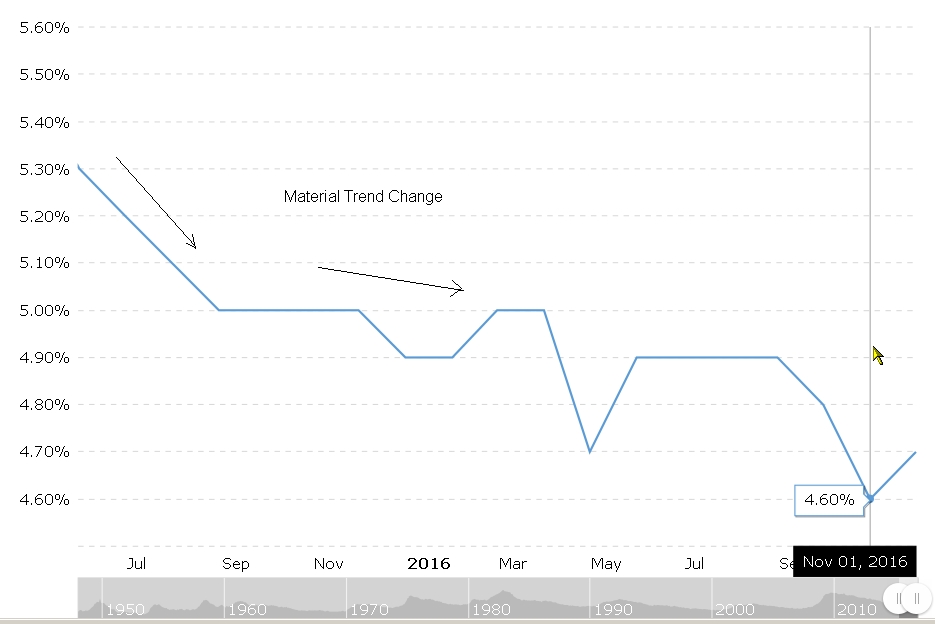
Ok, so now look at where we are (or have been) in the past 14 months – the slope has CHANGED, we are below 5% unemployment (for the most part STIFF’s are happy or oblivious). Note also how this is what might be (likely in my view) the bottom of wave 3, however this time the peak will not be 10%, but much higher – again symetry is the most likely outcome.
Finally the forecast – 2 scenario’s on slightly different time scales.
1) 4.6% is the final trough in the current cycle – not likely to go below that IMO for two reasons – slope change has already occurred 14 months ago and is in roughly in line with 1999 and 2007 ‘peak’ employment rates. – The forecast, again assuming symetry, we are now nearly 2 months past peak employment and within the next 6-12 months another recession will have begun and unemployment will spike on its way to well beyond 11% if the 3 cycle trend holds – this could get scary quick.
2) we may in fact revisit 4.6%, maybe a one month spike lower which would extend the next recession and unemployment spike cycle into early-mid 2018.
I do not see how the US will make it to 2019 and beyond without a MAJOR recession and double digit unemployment which is entirely reasonable given we’re at near ZIRP (Fed out of ammo) and most households are back to 2007 debt loads.
What does this have to do with PM’s – I don’t want to be holding paper when the next wave of ‘solutions’ arrive.
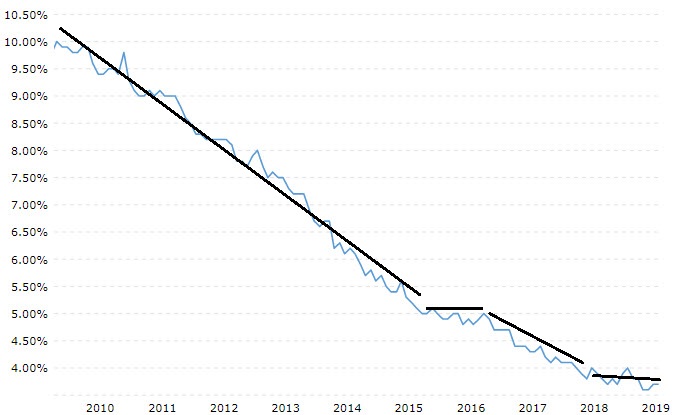
(edited 8/26/19 – updated main post with US unemployment trend chart from Macrotrends)
Per chart below – unemployment rate of decline has once again flattened (we’re 12 months into this one – similar point as when I initially posted at the end of 2016). We’re at the tail end (last quarter) of my prediction period and we shall soon see how this will end.
- Gold behavior indicates markets see real currency value going south (this time even against the USD). The last ‘clean’ shirt headed for the laundry basket.
- Like clockwork the fed funds rate has once again hit the declining straight line ceiling above zero (since the early 80’s), they’ve stopped raising rates and signaled yet another rate hike apex with a recent quarter point drop (in 40 years ‘this time it’s different’….. are we stupid?). Since going off the gold std. this type of action has always preceded the start of a recession (or worse?). The current Fed posture is definately a reactionary one and not forward looking to mitigate a crisis. What ever it take to keep the wheels on AS LONG AS POSSIBLE then SHTF.
- Inverted yield curve is steepening – if we do enter a recession how long will it will take US fed funds rate to hit ZERO and/or unemployment to spike – months? weeks? What other ‘tools’ does the Fed have in store for us? Keep in mind that after the ’08 crisis, the Fed has practically dissolved the MF MMKT, Commercial Paper and other ‘shadow banking’ cash markets in addition to allowing themselves to change rates with practically no notice (used to be 2 weeks) – just a guess, but possible ‘currency revaluation’ would be made easier (less disruption to markets) given these aforementioned actions – the Fed is preparing for something no doubt.
- International stressors are not abating – trade wars and military posturing.
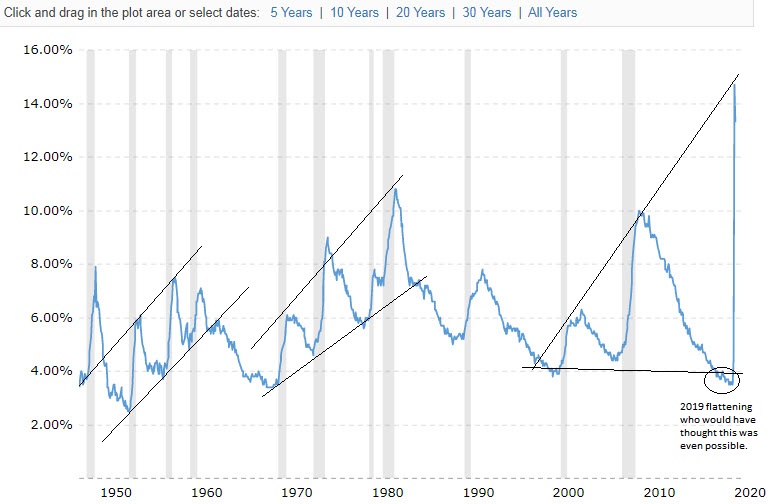
(edited 6/11/20 – updated main post with US unemployment trend chart from Macrotrends)
Aside from the periodic (6 month or so) updates I added above and to the response section below, I figured this (final?) chart should appear here. Re-read the original post above and at this point you decide if there is a greater ‘plan’ at work here or perhaps it’s just accidental.
Here’s my interpretation FWIW.
Politicians come and go however central bankers and the FED (whose mandate is ‘full’ employment and stable prices) have been with us throughout not to mention CB systems are now hugely international. Yes, as part of their original sales pitch, they flattened or at least obscured the volatility of the business cycle through fractional reserve banking and interest rate controls, but wasn’t one cycle simply traded for another? In reality there is NO FREE LUNCH but they have been able to perpetuate the illusion of prosperity to the STIFF’s and (again in my own opinion) western democracies are on the cusp of a new world order.
BTW, I just re-financed our home last month and magically I’m a few hundred per month ‘ahead’ – simply because the Fed decided to crush rates back to zero. Wish I’d figured this relationship out many DECADES ago that it is not in a parasite’s interest to kill the host, just keep it on life support.
“The human body generates more bioelectricity than a 120-volt battery and over 25,000 BTUs of body heat.” – Morpheus
Remember the #1 rule of FIGHT CLUB and the objective at the end of the movie.
Maybe Hollywood was trying to tell us something or possibly laughing that we didn’t ‘get the joke’.
GLTA.
It’s difficult to connect the dots toward a recession on his buy American hire Americans, make dollar cheap, FDI in USA, repatriate home to USA….
Wow YYZ…this is excellent out of the Box Analysis. Thanks for this insightful piece…its a keeper for the sidebar
(June 4 17) 6 months out and updated and relevant chart from ZH indicating that at 4.3% we are now below a 67 yr. average. According to my timeline ‘thesis’, it’s looking more like Q1 or Q2 2018 that the spike will occur. How low can it go?
http://www.zerohedge.com/news/2017-06-03/us-unemployment-rate-now-below-average-recession-entry-point
(edit 1/5/18) 12 months later and we’re leveled (3 months) at 4.1%, only slightly below the last check-in. Tension is building. Some market exponential acceleration charts.
http://www.kesslercompanies.com/stock-market-acceleration-final-stage/
(edit 5/6/18) 16 months later and we’re at 3.9%. It appears the leveling trajectory after the steep downslope that ended late 2015 is steeper than expected however still not as steep as the preceding econ ‘recovery’ phase. Obviously scenario 1) is OUT. Scenario 2 is still in play and currently at around 30 months old, if unemployment doesn’t spike this year we’ll be tied at 3 years for the longest period without a major uptick in the Unemployment rate since ’66-’69. Participation rate flatening at 63%, late 70’s level. Huge uncounted labor reserve (at levels just as women joined the workforce in late 70’s). With wges currently not supporting single income families (as they did in the 70’s), how are those removed from labor capacity surviving (not counted as ’employable’)? Gov’t programs, basement kids/adults, and perpetual studenthood. How low can unemployment go, how long before the spike?
(edit 09/10/2018) 20 months later and we’re still hovering at under 4% unemployment.
Here is a great 40 chart summary on ZH of where things stand at the moment.
https://www.zerohedge.com/news/2018-09-09/us-job-market-overheating-xxxx-charts
Probably the best chart illustrating the behavior/reaction of TPTB vs. the STIF’s mentioned in the initial post above is the one overlaying the Fed Funds rate vs percentage of states with unemployment below NAIRU. Note how little distance the Fed Funds target rate (red line) is above zero while we’re at peak employment (black line), not to mention we still have a huge overcapacity of non-producing (read dependant-on-State/Parents) labor with a Participation Rate flat lined at around 63%. IMO there is a huge reset on the horizon which could have huge US societal impact. Brace yourselves.
(04/05/2019) over 2 years since OP. What’s changed – 3/20/19 Fed reversing trend and announced no rate hikes for rest of year and only one possibly in 2020. 3/22/19 3mo vs 10y t-bill gap goes negative (inverted yield curve), events that for nearly the past 40 years signal an upcoming recession 12 months or so later. It takes about a 500 basis point cut to reverse a recession but we’re only 2.5% above zero. US Unemployment rate indicating that the current flattening period is now 12 months old (second step down since end of 2016) – another ‘step down’, flat (for how long) – or spike up? current US Unemployment chart