Northern Dynasty Still Rising
As I’ve got a good wedge invested in this, I’m watching the chart closely. Ignoring short term ups and downs, which can be huge, I’ve been trying to get a handle on what to look for when it tops. It could plummet from here and it could go up over 500%, but based on history what’s reasonable ? I’m ignoring fundamentals, news flow etc, etc, just looking at the weekly chart back to 2000. In 2003, the stock rose rapidly to 50 Cents. It did the same last year. Taking that as our starting point, in mid 2003 it took out a zone of resistance just below $2, it did the same a few weeks ago. Last time it rose to $6 in the following 6 months, with a spike to about $9 (before rising further in subsequent years).
Do the indicators support more upward moves in the price ? Well, just looking at a few – the RSI spent 8 months above 70 last time, that would give us until about June. The MACD hit at least 1.0 last time, we’re currently on about 0.5, and the TSI hit 75 – we’re on about 53 just now.
IF history is a guide, it might be reasonable to expect some sort of peak in the early Summer. Of course, we’re in a very different world now, compared to 2003…
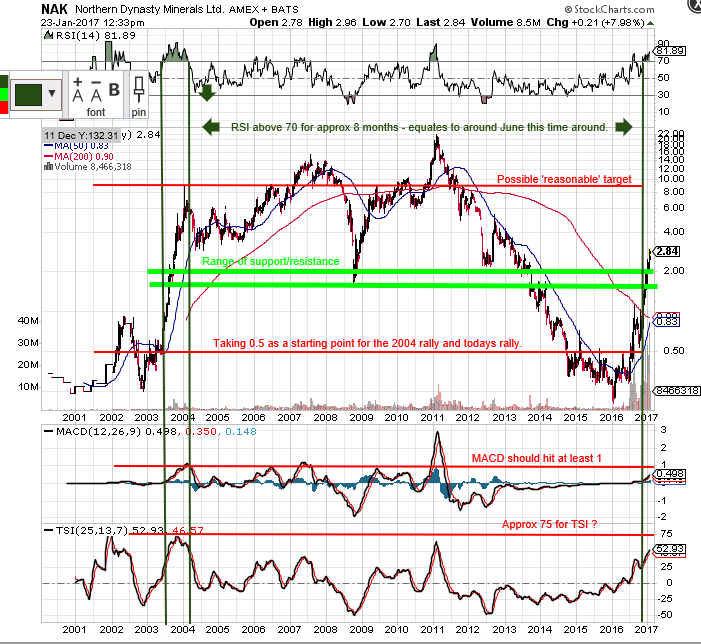
Edit : Also bullish is the approaching 50wma/200wma crossover.
You GO Northstar
I bailed last week
sheesh
I’m probably going to wish I did too, but when those indicators turn, I’m out.