Gold Perma bull of 200 years
To quote Spock : ” Look at the forest not the grass”
Truely gold and general market have been in perma bull trend.
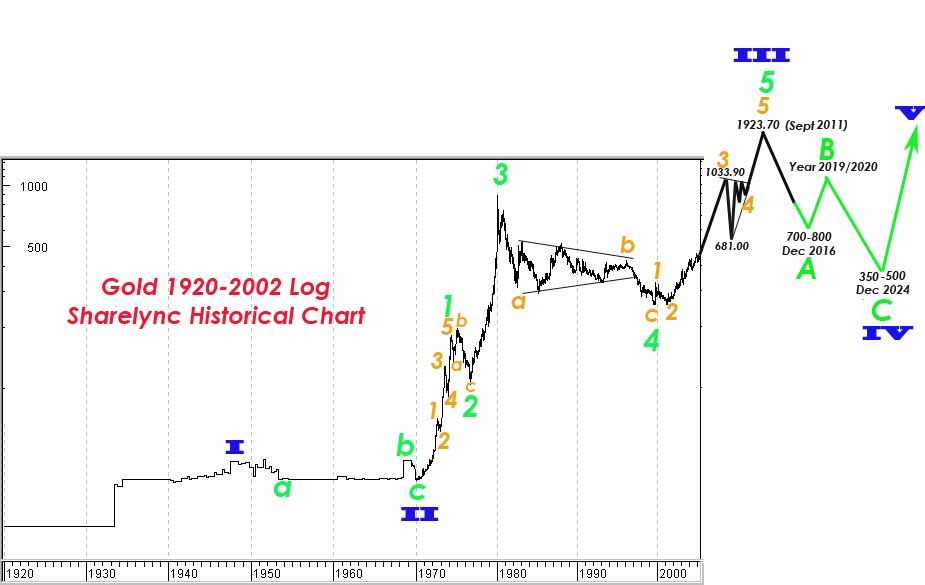
Pedro’s long term gold’s EW count going back 1800 to 2013 shows that gold has never violated the previous lows starting point of where the next impulse move began.
Higher high and higher lows- a true definition of a bull market.
———————————————————————————————————–
Alf Field’s theory from 1970:
“The beauty of EW is that the corrections in gold are remarkably regular and consistent.”
“Using this method I calculated that the gold price should rise from the $300 ruling in 2002 to at least $750 without having anything worse than two 16% corrections on the way. That was valuable information at that time. Furthermore, from the $750 target a big 32% correction could be expected to about $500. Then the bull market would resume, rising to perhaps $2,500 before another 32% correction occurred. The final up-move would take the gold price to much higher levels, possibly $6,000. Once again, a valuable insight when gold was $300 in 2002.”
——————————————————————————————————————-
Going forward after gold bottom at 1045 applying the same rule of consistent correction one can forecast the next gold target using the past data from Pedro’s long term chart.
Note the major corrections and extension of gold price after it bottoms.
Year to year:
1933 to 1951: $20.57 to $44.05 = + 2.14 times, 18 years
1951 to 1970: $44.05 to $34.75 =-$9.3, -21.1%, 19 year
1970 to 1976: $34.75 to $195.25 = +5.62 times, 6 years
1976 to 1978: $195.25 to $100.5 = -$94.75,- 48.5%, 2 years
1978 to 1980: $100.5 to $850 = + 8.4 times, 2 years
1980 to 1999: $850 to $252.8 = -$597.12, – 70%, 18 years
1999 to 2011: $252.8 to $1937.2 = + 7.6 times, 12 years
2011 to 2016: $1937 to $1045 = – $892.20, 46.0%, 5 years
What will be the next target from 2015-2016 low using this historic pattern and consistency of gold over 200 years???
Will next Extension in gold price be 4X, 6X or 8x from $1045????? Past extensions of gold price have been in Fib numbers 2, 6, 2, 12, ??????
Gold follows Fib for price and duration. FIB numbers are 1,2,3,5,8,13,21,34….
Gold has been in correction for last 5 years (fib). Next fib is 8 years. No one thinks gold will be in correction for additional 3 years.
Applying The rule of alternation gold up cycle should be up for next 5 (fib) years as last up cycle was 12 years (close enough for 13).
maybe this will be usefull for you.thanks
https://www.peterlbrandt.com/wp-content/uploads/2016/04/Chart-history-of-Gold-market_Feb_2016.pdf
Very useful document thank you. What stands out for me is:
? Remeber, though, falling wedge patterns have the tendency to back and fill, even moving well back into the wedge itself. Even after a wedge completion a decline back to 1100 to 1125 is possible. An initial bull market thrust cannot be ruled out.
? A failure of prices at the upper boundary of the weekly chart wedge would indicate that Gold could retest its lows at 1050
? Gold is poised to ring a bell, but further chart construction is required. Seems like we are here right now…having back tested. Thoughts?
So, the chart shows we don’t reach previous highs, even by 2024. That’s disappointing.
Point was not the chart.
The chart was used for the price of gold for over last 200 years only.
Think this is a chart from years ago And if the bottom was 1045 not 700 the new high comes much sooner.
Chart is not providing the next move. By 2024 price of gold will be much higher.