NAK- Attempting to read the tea leaves
NAK of course has been the power move of the past 6 months. Recently it has been the pump story of Marin Katusa… However long before Marin’s pump play I revealed this stock as my special Hillary Hedge in the last election. Once it was announced that Frank Giustra was pumping $20 million into this company it didn’t take me long to instantly put 2+2 together and see this move as the next Clinton crony cash deal. After all Giustra had previously pumped over $100 mil into the Clinton slush fund in a pay for play uranium deal against the American people.
It was clear to me at least, that riding along Franks coattails was the best way I could mitigate the pain of seeing Hillary in the white house. At least the money gained would soothe watching the corruption at the top.
But, low and behold we witnessed the biggest upset in american political history and we now find ourselves smack dab in the most business friendly administration since Calvin Cooledge. Holy cow NAK is now squarely back in the saddle, back in the game. Granted this is for now just a permit play, but its been a heck of a ride.
I have traded it a few times on the way up increasing my holdings each time. So now I find myself asking where is the next level to sell. In other words can I use TA to read the tea leaves?
Let’s make this a group exercise. I am going to post a chart with some indicators and tell you what I see. I acted on these observations today by selling 2/3s of my position. That always makes me nervous because one of the biggest risks in a bull market is to be left standing on the loading dock watching the train pull away from you. (Such is the life of a trader)
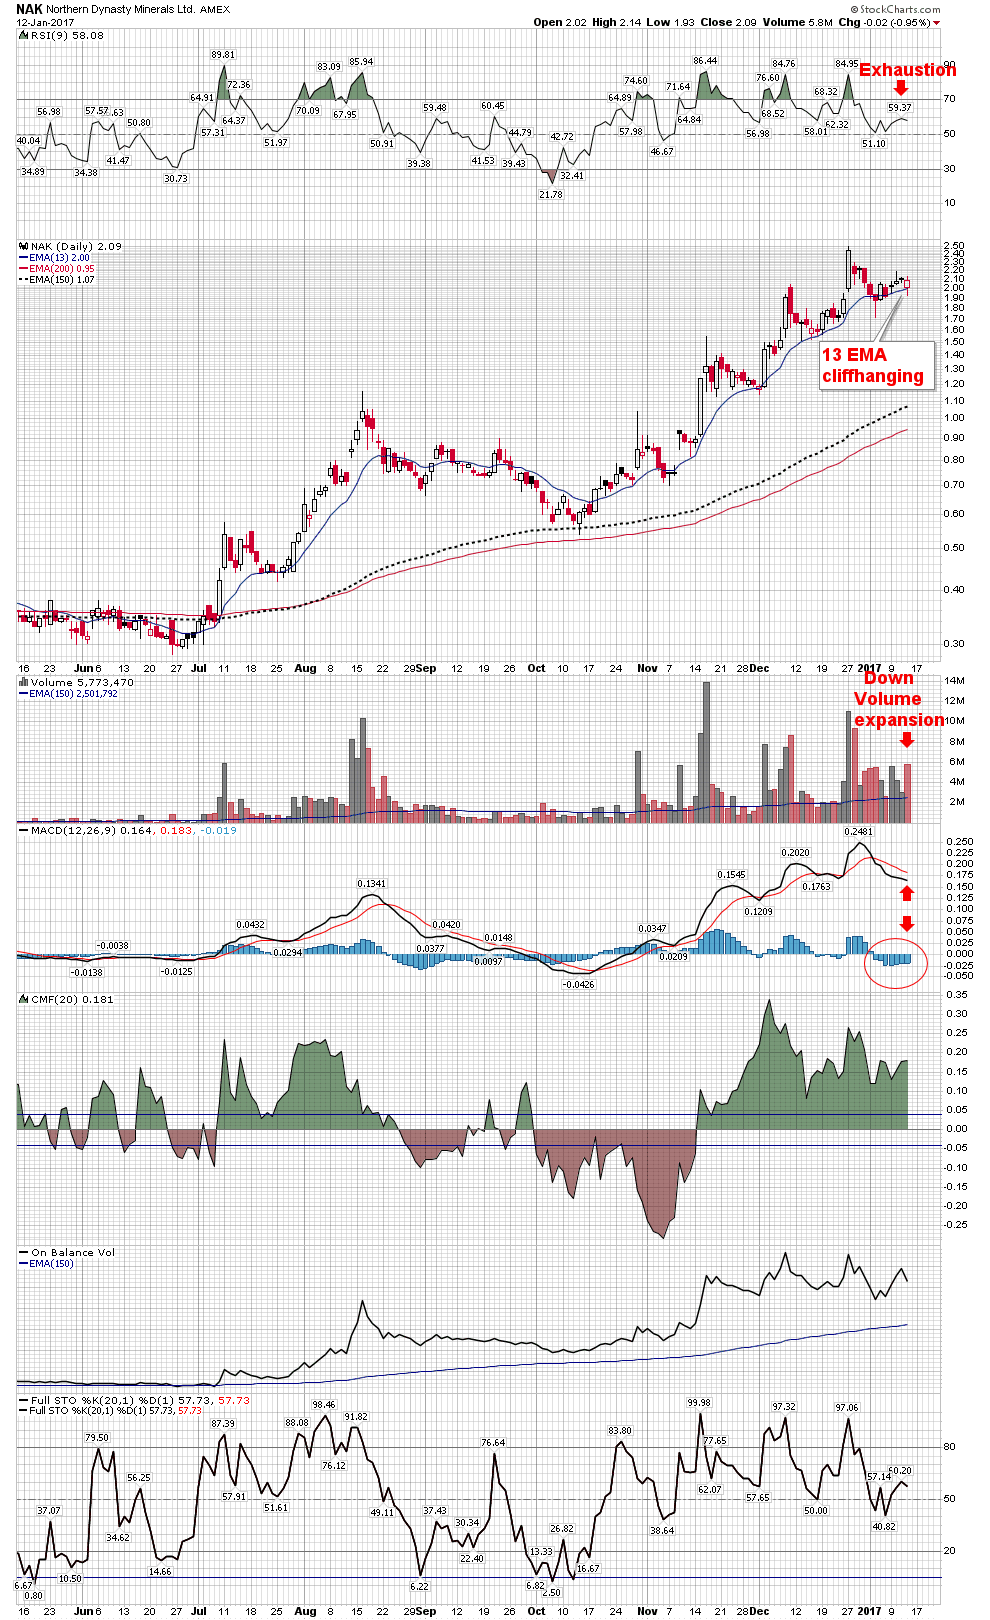
Top to bottom:
#1 RSI- looks to be signaling exhaustion. Note how this muted bounce from the last pullback just does not seem to have the juice anymore. Plus the last 3 price spikes could not move the RSI to a significant new high.
#2 13 Day EMA. This has been a great indicator to follow as it has acted as support for the move. Its right there hanging on a cliff. One down tick from here and it indicates a sell.
#3 Volume. Note todays downside volume bar. Its expanding….not good.
#4 MACD Here is the biggie IMO. Look first at the Blue histograms of the past 4 peaks. The first 3 they retreated back to the zero line then held, however this current pullback they went negative and have stayed negative. Above this we see this same dynamic by observing the black line staying above the red line in pullbacks…. not with this one. Again reading the tea leaves here.
#5 CMF. Still bullish, but showing less strength than before. (still a positive)
#6 OBV & Stoch positive but note a series of lower highs.
Bottom line price can do anything but taken as a whole these indicators show momentum is waning. Does it have enough umph to make another thrust higher? Possibly, but I am going to bet maybe not. My goal is to reload at lower levels
I only use daily charts to examine, roughly speaking, price trends for the current month (ie, short term).
And weeklies to look back over six months to a year.
To answer your question, I use monthlies.
My top indicator is recording a sell (a decline — its first reversal since last May), but also from very elevated levels.
Same for RSI.
My CCI based indicator has been OB to an extent not seen since 2011 high. All good reasons for caution/take some off table.
Nothing is close to triggering outright sells in a LT sense. Just IT.
So … my sense is that in a few months, it will resume higher. That could well become the divergent final high for this rally.
Well played, is my sense. So far.
My weekly shows Stoch just now rolling over (initial move) to 73/76. Some technicians consider a strong caution when it drops down below 78. So if one has a hair trigger (I do for this issue) one sells based off the weekly stoch.
Sounds like your method is much more long term based, not applicable for what I am trying to do here. Other strategies would use it.
Thanks
RIC is getting ready to dump…
Is that from RICs Twitter Account ?
Who Gives a SH$%T
🙂
I have a couple charts posted now
Thanks Plunger. Had a look now, but will study again later. Any Rick Rule sightings lately?
Eagle: Please tell this RIC guy to flush.
Richmont Mines…
Nice post plunger. The CMF also has a negative divergence on the last three peaks, more so than the RSI.
I bailed on all my NAK at the last peak with a limit order at 2.40 as I had a parallel price channel base on the previous two peaks from Nov 16 and Dec 12.
Heroic move… nicely done
These Guys are Good
Thanks for the Post Plunger! Time to book some NAK gains and follow suit.
Many, many thanks for this post, Plunger!
I bought 15,000 shares @ $.88 based upon one of your earlier posts and I’m SOoooo glad I did.
However, since I sold 7,000 this morning @ $2.10, NAK should be above $3.00+ by the middle of next week.
Hope you didn’t sell all of yours.