Still Watching These 2 Charts With Interest
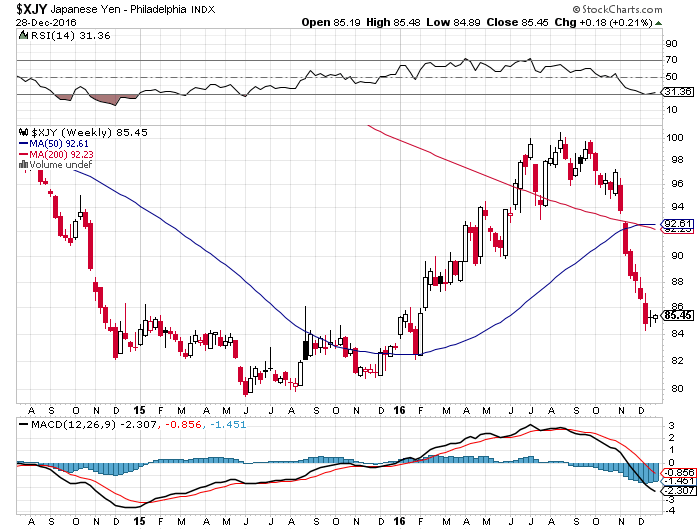
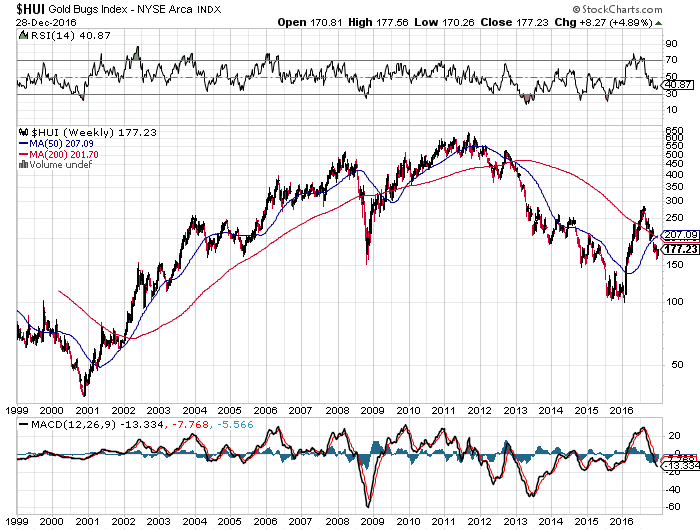
Just a reminder, from my post a couple of weeks ago. When these 2 charts display a crossover, with the 50 week moving average (blue line) moving above the 200 week moving average (red line), historically it has preceded a move to the upside (see my 3rd chart).
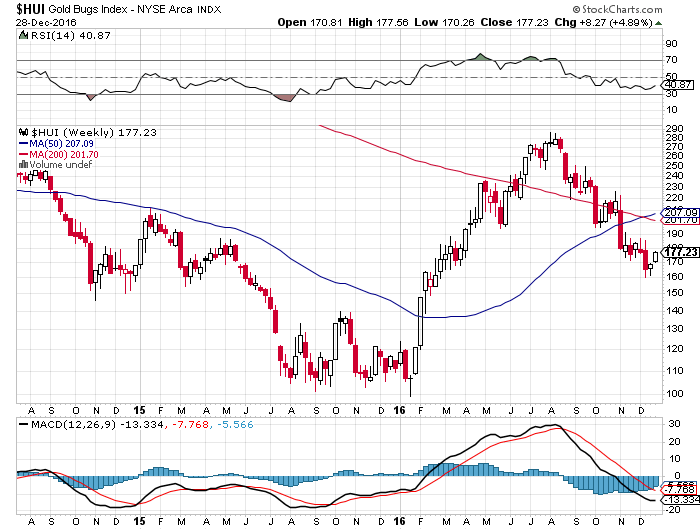
Interestingly, this will be the first time the 50wma has moved above the 200wma, with the HUI below the crossover point. We’re currently around 177 on the HUI, and the moving averages just crossed over somewhere around 204. I also notice the RSI and MACD are beginning to turn upwards…
We need a rapid move above the 200 level to prevent these averages making a bearish crossover. Based on history, and a good weight of evidence from others who have posted here, that is what I’m expecting. BUT, I’m not 100% convinced, because there is also a good counter-argument which suggests more downside. As a result, I’m back in the game, having bought selective miners, with more ‘dry powder’ to deploy once I’m convinced.