“When all the experts and forecasts agree – something else is going to Happen” – Bob Farrell
Gold looks terrible on the charts. Just plain terrible. And regardless of being oversold and today’s short-covering bounce, it clearly remains in a downtrend. As I see it “them’s the facts”.
But bearish sentiment is so hard and thick you could cut it with a knife. I’m seeing nothing but articles like this: http://www.marketstoday.net/analysis/Analysis-Commentary/gold-due-for-a-bounce-but-remains-in-long-term-bearish-trend/18764/en/
And research like this from the Vampire Squid (Goldman Sachs):
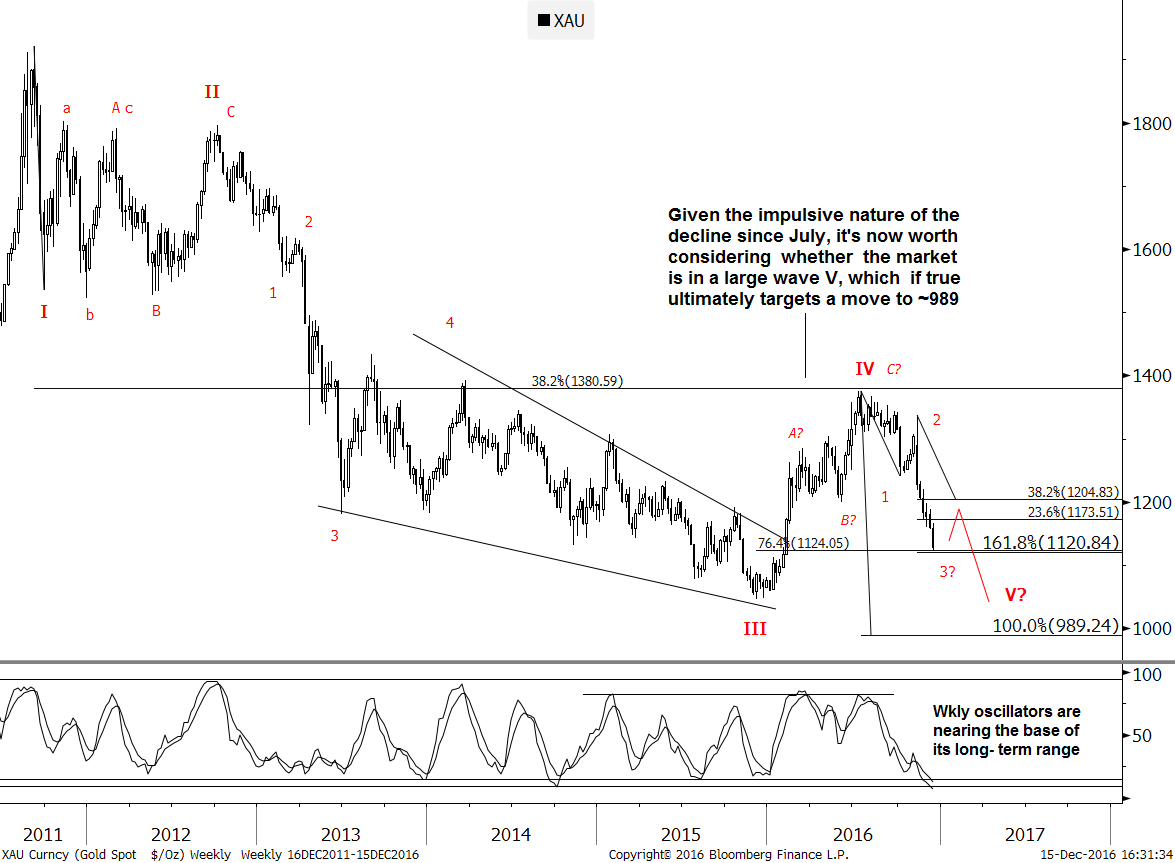
? The decline since July is much more impulsive than
initially anticipated. It’s worth considering whether this is
actually in a large Vth wave of a sequence that started at
the ‘11 peak (similar to the DXY, Oil, and many other
charts discussed in this chart pack). This wasn’t the initial
wave count included in previous updates, but it’s now
looking like it makes a lot more sense from a cross asset
perspective.
? If this is truly the correct interpretation, wave V has
scope to eventually reach 989 (if equal to the length of
wave I).
? Tactically, the next level to watch is 1,124-1,121
(includes a 1.618 extension from the Jul. ’16 high). A
retracement from current levels could test ~1,173.51
(23.6% of the decline since Nov.). It shouldn’t go much
higher than 1,205 (38.2%). Getting this retrace will
provide an attractive level to consider re-establishing
bearish exposure.
? View: Consider adding bearish exposure near 1,173.51. No higher than 1,205. Scope to reach 989 (wave V)
.
Maybe the shorts are about to get skinned before we head down again?
thanks.good post.minimal reasons to be bullish now.it not the time yet to be contrarian
This analysis keeps be in perspective…Thanks BBMan…
A. Thank you for your interesting comments.
B. With two partial exceptions and one fairly strong exception (which you have provided) I have not had much luck with sentiment indicators and suspect them to be over-rated, though I may just expose my foolishness.
1) I have a little luck trying to sense my own emotions and going against them. This sentiment indicator may have a little value.
2) I have some sense that sentiment indicators work pretty well as confirmation of other signs. For example, if charts look pretty good and sentiment seems horrible, then that may be the equivalent of charts looking wonderful. On their own, I’m not so sure indicators of sentiment are so safe to go on. (Here you make a point about oscillators, so I do not want to use the case at hand as an example.)
3) Here’s one reason your post is especially useful: I haven’t logged all the past data, but I have the strong impression that seeing published “Goldman Sachs says do X” means one does well to do not-X, certainly with the e-Au market. However I am not convinced that this point is fully an indicator of sentiment. Maybe it has something to do with sentiment of those who follow GS’s advice or even those who come out with statements for the public, but not necessarily the true sentiment of the GS bigshots.
3a) Similar point: I have the impression that seeing that “George Soros has taken position X” is almost as reliable as a sign not to take position X, though there is often a longer lag time for this sign than with the Goldman Sachs sign. Again, sentiment indicator in the sense of sentiment of those who follow the news (or fake news) item. This particular GS, Soros, may have indeed taken position X but I cynically suspect he often quietly gets out of it or takes an even weightier counter position occultly.
The GS count fits what I’m seeing well. As reflected in my posts prior to seeing this count.
Where I’ve said I’m expecting a dead cat, then lower into spring.
And way back last spring, I expressed my view that the early year rally was an BMR for IV, with the strong move from Jan. as the C of an ABC.
I also sent FGC a PM last night, warning of the potential for a drop like 5 of V if this imminent rally doesn’t get legs.
I agree with your suspicion as stated. At the low overall opinion is always bearish and expecting price to fall further. Otherwise it would not form a low.
I will add onto what Karl said regarding GS:
First off Goldman would never give away investment advice for free. Therefore, anything released into the public realm for “free” as in no charge is only intended to manipulate the public. When stated this way this becomes such an obvious truism. Therefore what is their intention? Well that’s where the handicapping comes in. Two examples demonstrate.
#1 in May 2008 GS publicly proclaimed in loud announcements that oil was going to $200. This was a case of yes immediately do the opposite that Goldman says. They used this loud market prediction delivered to the public for “free” to have someone to sell to. Nothing like creating your own demand to sell into….crooks they are.
http://www.nytimes.com/2008/05/21/business/21oil.html
#2 was the public trading advice they gave for “free” to short gold on April 10th 2013. Two days later gold started its crash and within 4 days had dropped $250. So this was a case where it would have paid to do what Goldman did. So why? Certainly Goldman was fully short before their public call. Obviously they wanted to spark panic and yell fire in a crowded theater. This worked very well for them. Think about it when does Goldman ever say to short anything? Crooks they are.
http://blogs.barrons.com/focusonfunds/2013/04/10/goldman-urges-investors-to-short-gold-get-ready-for-lower-gold-price/
So the lesson is that one must determine their motives when they make such a public pronouncement, but the one thing that is known is they are attempting to manipulate your behavior.