GDXJ Daily
Sir Randy’s GDX chart showing the falling wedge got me thinking. Anyway, here is the GDXJ daily chart. Do you remember the solid blue trend line that the March diamond is resting on? That’s the extension of the top trend line of the expanding wedge that launched the baby bull.
BTW, what’s the nature of that gap that happened in the miners on Thursday last. Is it a break away gap, a continuation gap, or (fingers crossed?) an exhaustion gap? Its also possible the gap has no meaning at all.

Here is a longer view of GDXJ daily. Note where GDXJ has found the 400 DMA, the extension of the top trend line from the expanding wedge, and the top rail of the 3 year falling wedge.
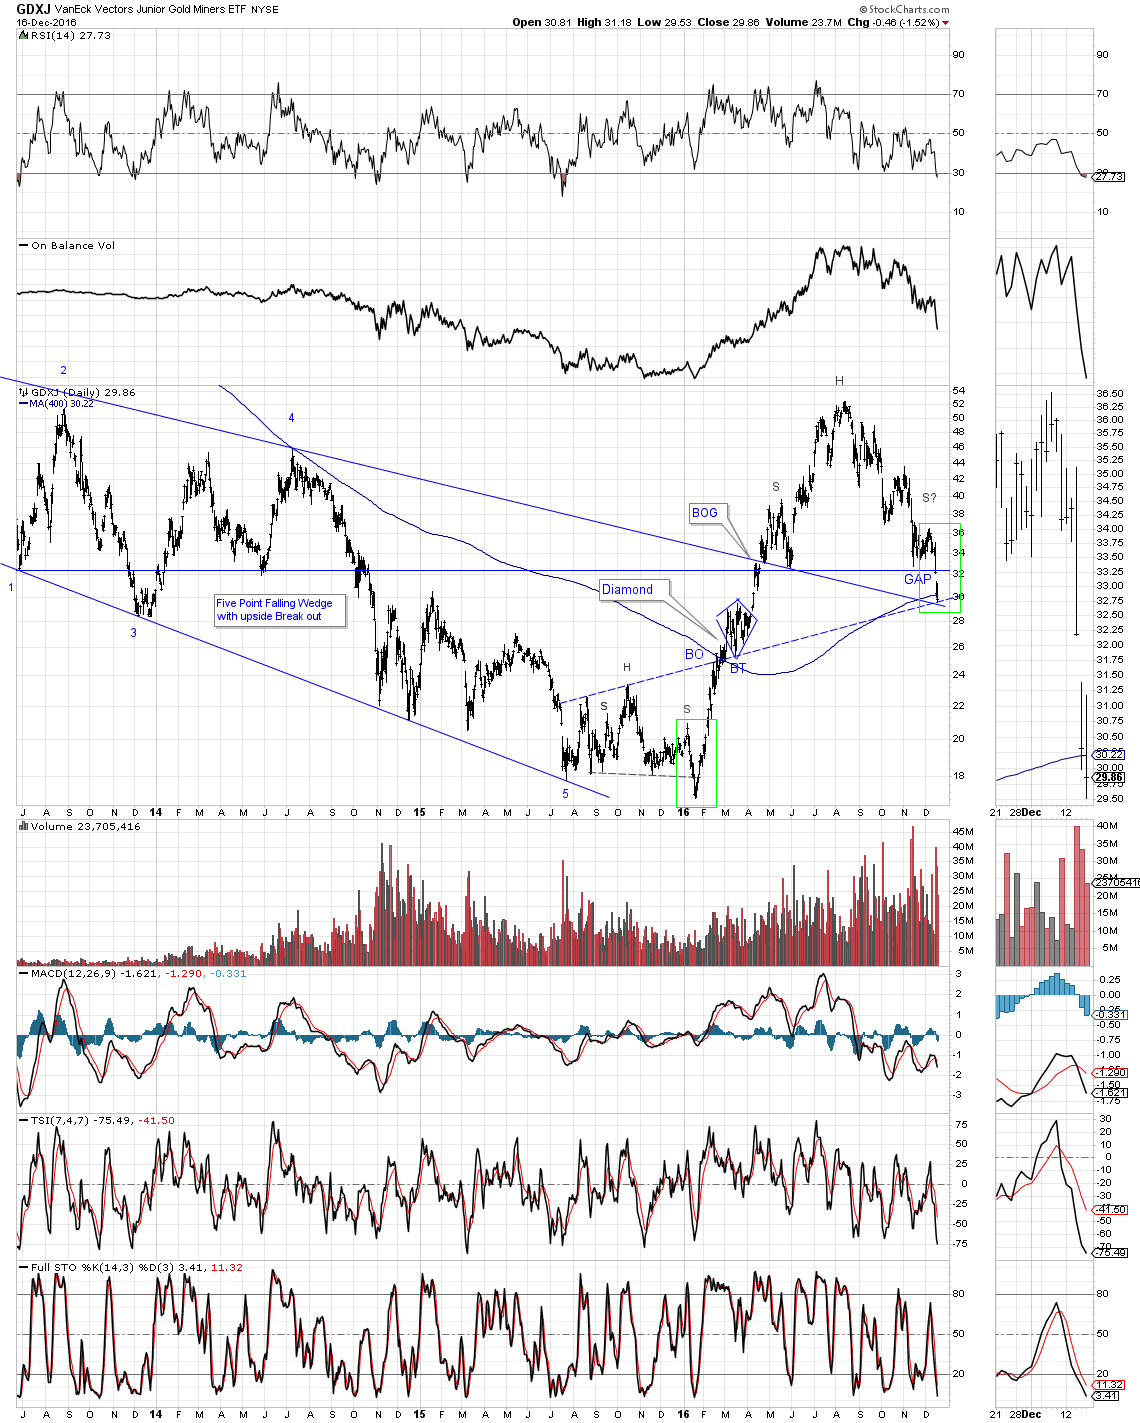
One more thing – the chart similarities inside the green boxes. Kind of interesting. Not saying a big rally will launch from here, but it sure would surprise a lot of folks if it did. It’s got me wondering…
Excellent forensic charting!
Great post. Thanks.