Gold – Where’s the Bull?
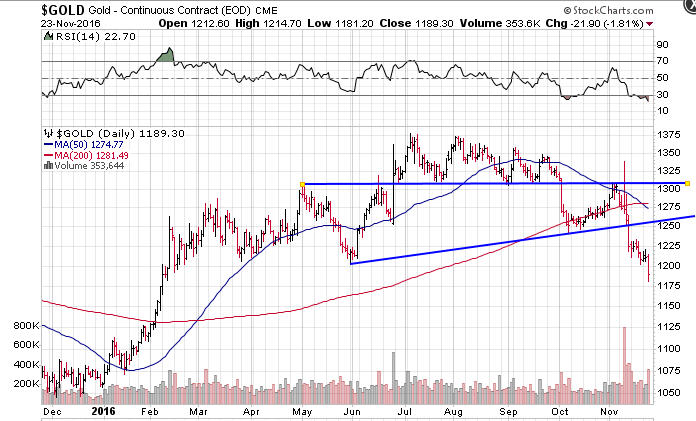
Looking at this first chart I see longish term support broken to the downside. Second chart is in more detail. H&S top that plays out perfectly. Perfect shoulder formation with not one but two backtests, both failed. Increase in volume when the shoulder line was broken to the downside, volume shrank on the recovery to the first backtest, then exploded on the way down. Add in the 50 day MA crossing down through the 200 day MA to confirm the Bear.
I could see another backtest to ~1235 on the first chart and perhaps a bit higher for the second, maybe 1260. that would be consistent with the dollar chart halfway point that FGC posted. Dollar drops a bit, gold rises, then the dollar goes off on its merry ride to 120, while gold sinks to 700 +- 100.
Where is the bull market in these patterns? Gold thrives on fear and/or inflation. Not much fear going around if other indicators are to be believed, and inflation is all but dead for the foreseeable future. Throw in the upcoming FED rate rise called for by the 90 day and 1 year T-bill yields and all I see is dollar bull, gold bear.
Happy Thanksgiving!
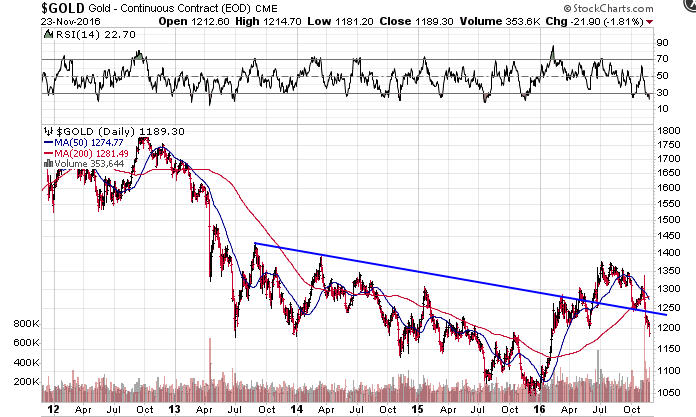
As for your first chart … all true but when you skip the march-14 high (FBO) and then connect the tops with more points in total and therefor lowering the blue line then your blue line would meet yesterdays low and could give support. All depending on how to draw your line and which glass to look through. As usual we will see.
correcting my post above … then such target would be around 1170 as for support.