GLD – BULLISH DOJI STAR
Definition
This pattern appears in a downtrend and warns that the trend will change. It consists of a black candlestick and a Doji with a downward gap at the opening. When the Doji is in the form of an Umbrella the pattern is called “Bullish Dragonfly Doji”, and in case of an Inverted Umbrella it is called “Bullish Gravestone Doji”. Here, all these patterns are subsumed, under the name: “Bullish Doji Star”, regardless of the shape of the Doji.
Recognition Criteria
1. The market is characterized by a prevailing downtrend.
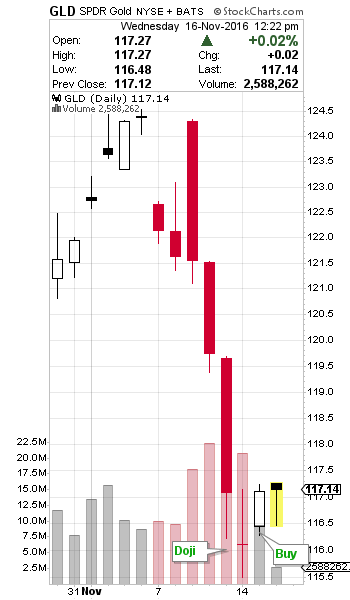
2. On the first day a black candlestick is observed.
3. Then we see a Doji on the second day that gaps down.
Pattern Requirements and Flexibility
The Bullish Doji Star should start with a normal or long black candlestick. It must continue with a Doji gapping down.
Trader’s Behavior
The market is in a downtrend and a strong black candlestick further confirms it. The next day opens lower with a gap down, and the trading is in a small range. The day closes at the opening price, causing the formation of a Doji. Bears were in control during the downtrend but now a change is implied by the appearance of a Doji Star, which shows that the bulls and the bears are in equilibrium. The downward energy is dissipating. Things are not favorable for the continuation of a bear market.
Buy/Stop Loss Levels

The confirmation level is defined as the midpoint of the gap between the Doji and the previous candlestick. Prices should cross above this level for confirmation.

The stop loss level is defined as the lower of the last two lows. Following the BUY, if prices go down instead of going up, and close or make two consecutive daily lows below the stop loss level, while no bearish pattern is detected, then the stop loss is triggered.

gld-candlestick
SLV – BULLISH HARAMI
Definition
This pattern consists of a black body and a small white body that is completely inside the range of the black body. If an outline is drawn for the pattern, it looks like a pregnant woman. This is not a coincidence. “Harami” is an old Japanese word for “pregnant”. The black candlestick is “the mother” and the small candlestick is “the baby”.
Recognition Criteria
1. The market is characterized by a prevailing downtrend.
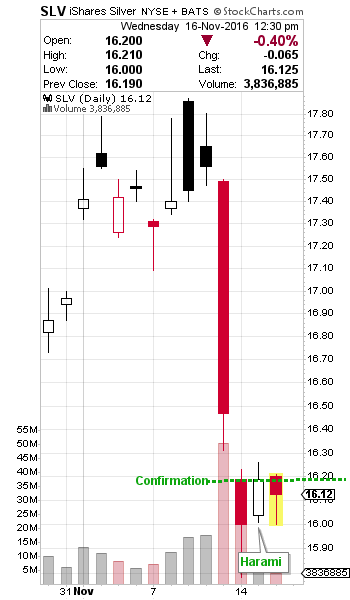
2. A black body is observed on the first day.
3. The white body that is formed on the second day is completely engulfed by the body of the first day.
Pattern Requirements and Flexibility
The pattern consists of two candlesticks, in which the first day’s black candlestick engulfs the following day’s white candlestick. The first one has to be a normal or long black candlestick. Either the body tops or the body bottoms of the two candlesticks may be at the same level, but whatever the case, the white body should be smaller than the previous black body.
Trader’s Behavior
The Bullish Harami is a sign of disparity in the market’s health. The market is characterized by a downtrend and a bearish mood, and there is heavy selling reflected by a black body, which further supports the bearishness. However, the next day prices open higher or at the close of the preceding day and the short traders are alarmed. This leads to the covering of many short positions, causing the price to rise further. The latecomers short the trend they missed the first time, and slow down the rise. Thus, a small white body is formed. This may signal a trend reversal since the second day’s small real body shows that the bearish power is diminishing.
Buy/Stop Loss Levels

The confirmation level is defined as the last close or the midpoint of the first black body, whichever is higher. Prices should cross above this level for confirmation.

The stop loss level is defined as the lower of the last two lows. Following the BUY, if prices go down instead of going up, and close or make two consecutive daily lows below the stop loss level, while no bearish pattern is detected, then the stop loss is triggered.

slv-candlestick