Correlation between CPI and Energy prices is impressive and instructive.
Here is my article on my own blog at
http://1000gold.blogspot.co.uk/2016/10/cpi-has-informative-correlation-with_27.html
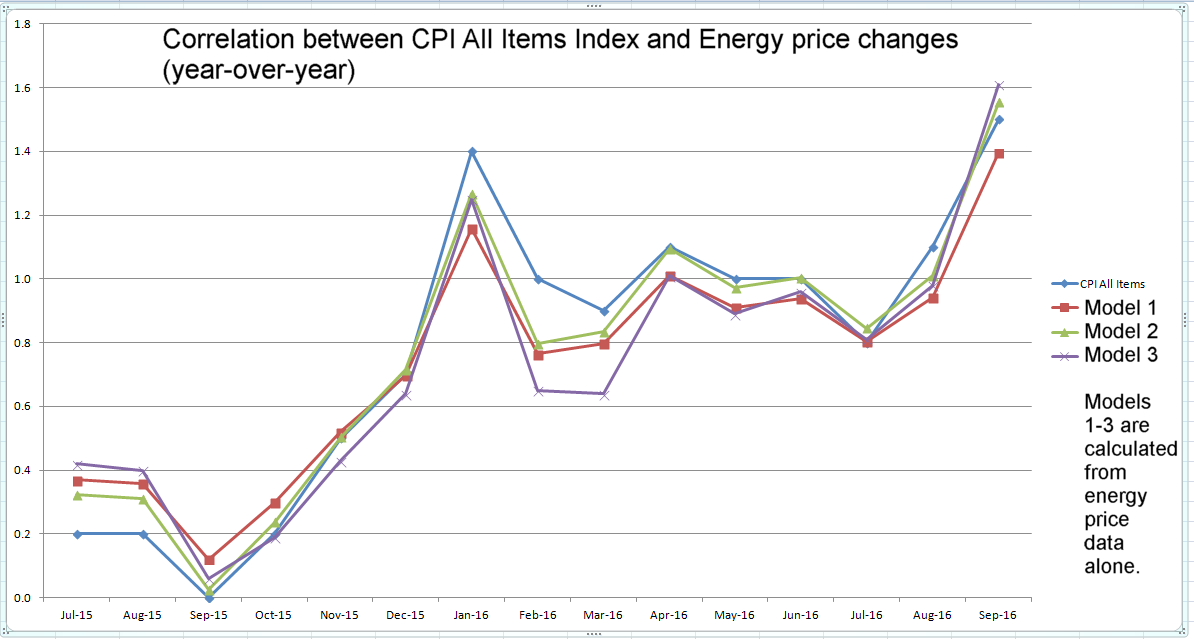
The CPI index for all items, year over year, has a remarkable correlation with energy prices over the past 16 months.
So much so, that one can take the year over year energy price changes as given by the Bureau of Labor Statistics (BLS) in their inflation reports and predict the All Items inflation rate to within about +/- 0.1%.
In the following chart, I have used the energy price changes, scaled them by a weighting and overlaid it on the CPI all items index graph. EC on the charts stands for Energy (price) Contribution. Energy typically contributes about 7% of the CPI with slight month to month variations in the BLS data.
Blue line is CPI All Items index year over year for each month reported
Red, green and purple lines are calculated from changes in energy prices using three slightly different models.
I believe that this shows that inflation is critically dependent on energy price changes as the energy bear market might be starting to flatten out and turn up. This has big implications for interest rate policy and gold prices going forward.
I am going to be doing further research to put into a more comprehensive report that will be available from my blog above, probably by the end of February 2017.
The basic comparison between CPI and energy price changes:

Top Shelf Original Work Dave
Thanks !!
Cheers! It’s an interesting one to watch.