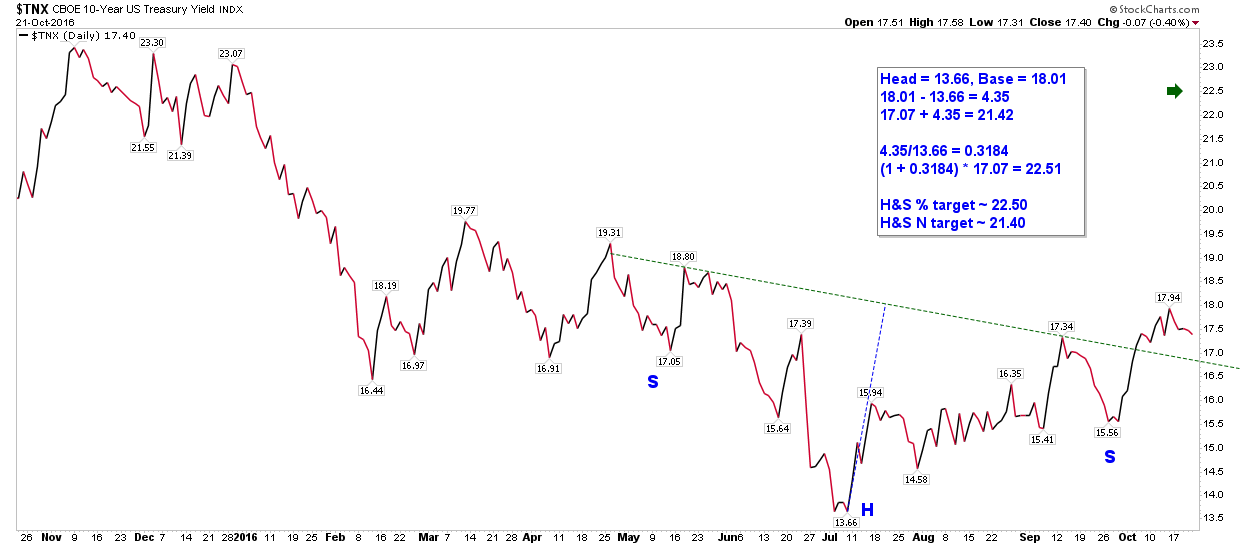
$TNX-Derived Target For Gold ~ $1075
In the next couple of months I’m looking for $TNX to rise up to approximately 22.5:
In the meantime, I’m looking for the $GOLD-$TNX ratio to rise to backtest the neckline of this H&S pattern, then fail there:
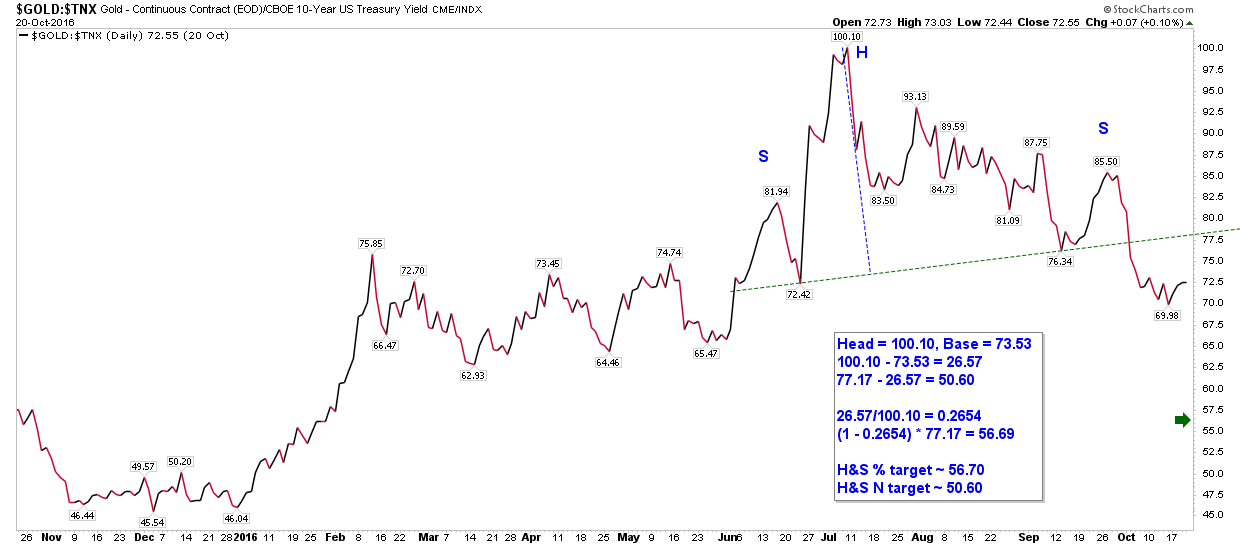
Thereby forming a RHS for a larger H&S pattern on the $GOLD-$TNX Ratio:
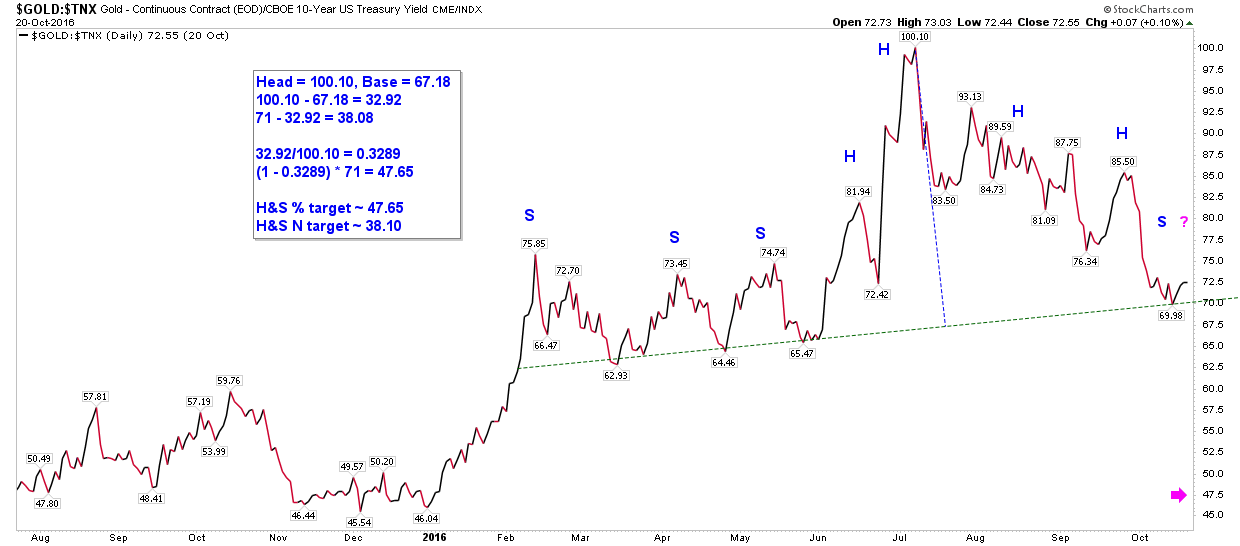
Monthly chart for $GOLD-$TNX looks to me like it wants to fall back to approximately the 46.75 level, confirming the above:

46.75 x 22.5 = $1072.13
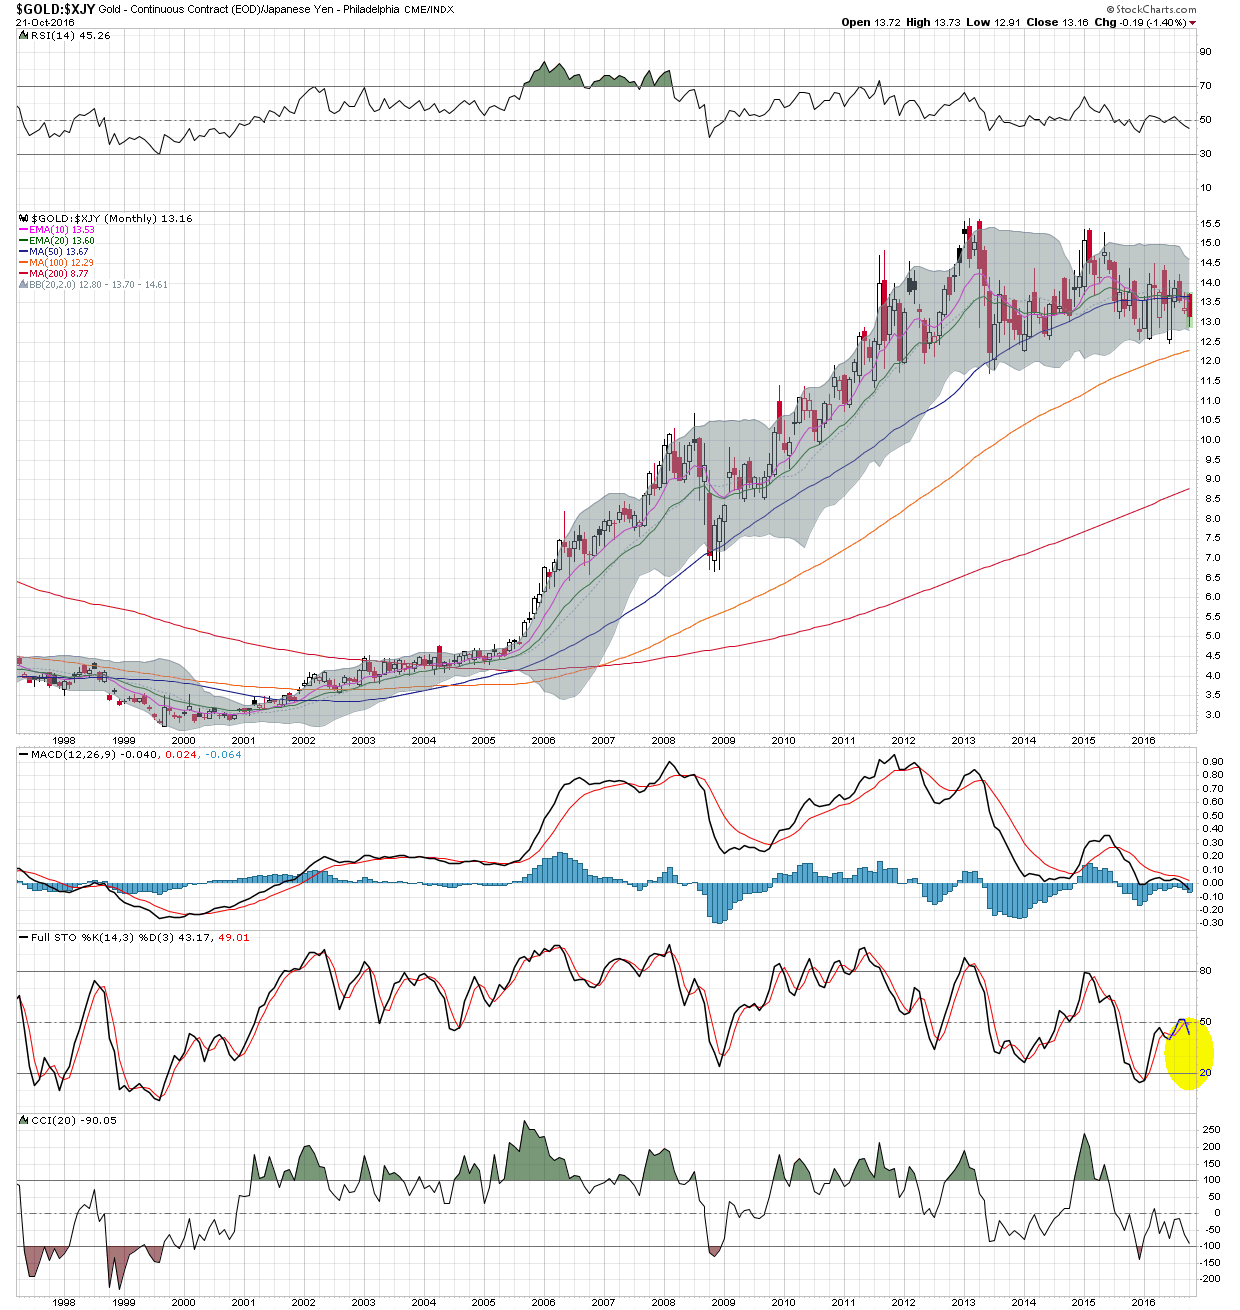
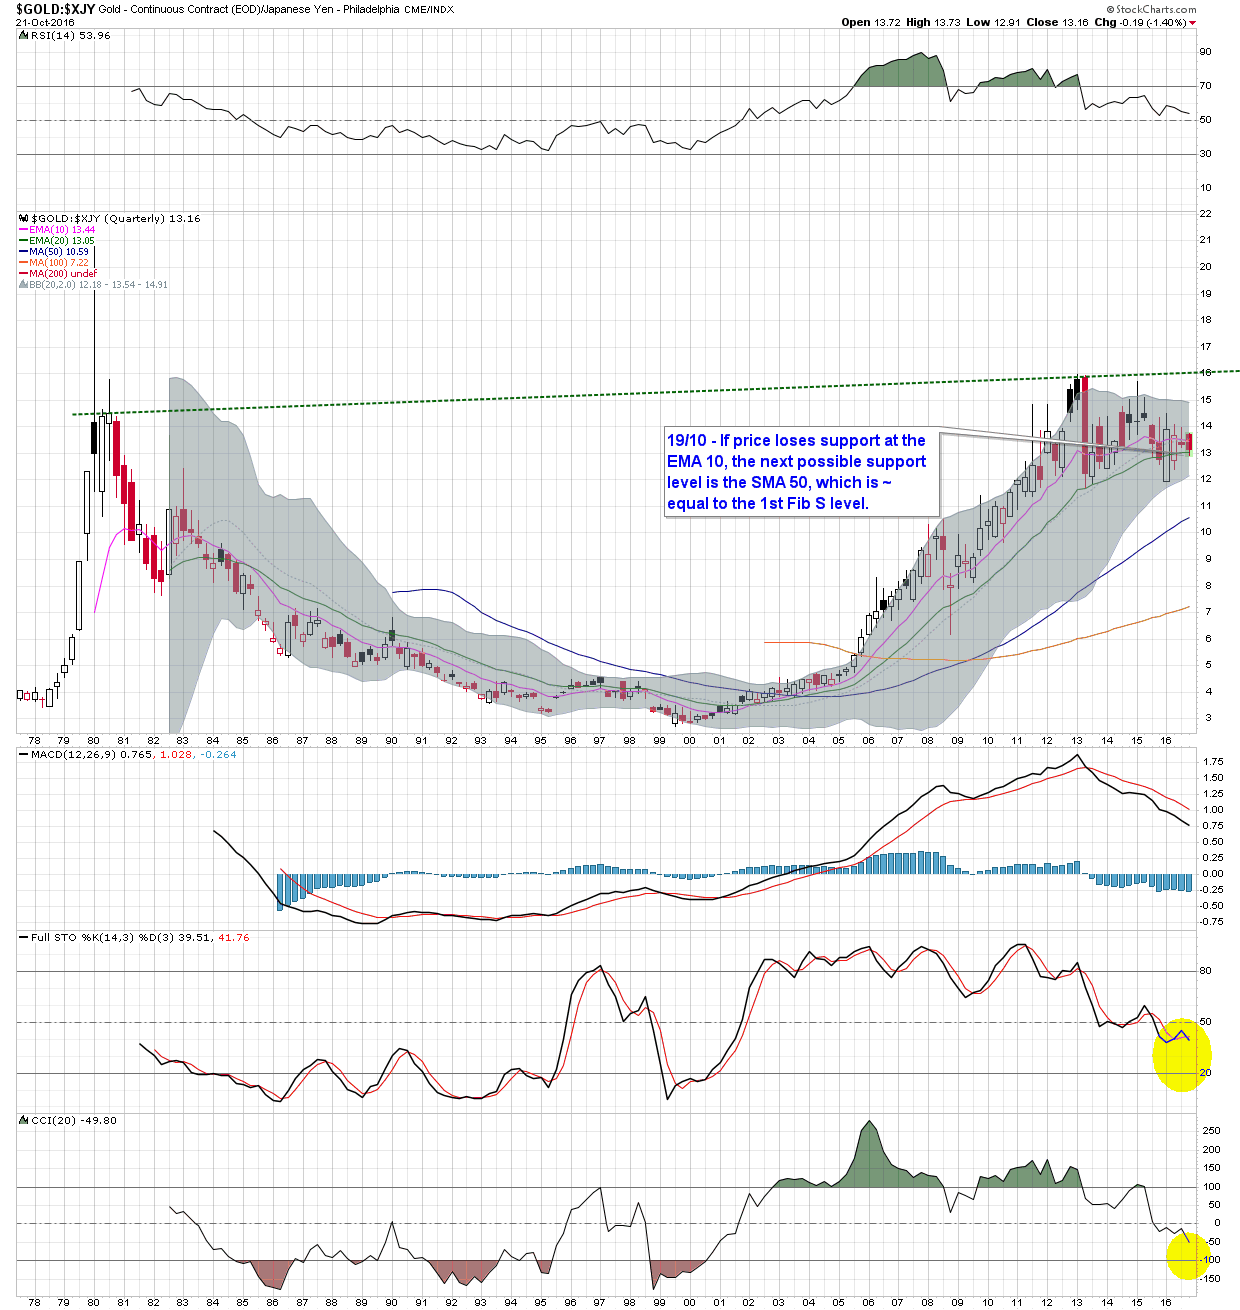
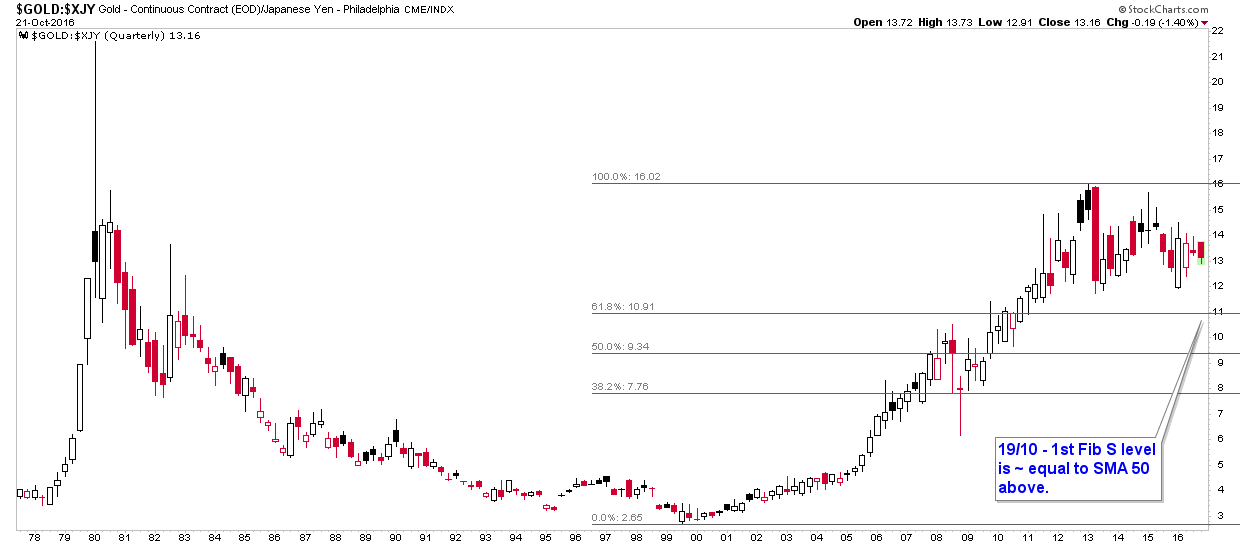
Both $XJY and the $GOLD-$XJY ratio suck for gold too IMO, adding to the case. Massive potential cup & handle formation on the $GOLD-$XJY quarterly chart
looks interesting though, to say the least: