SPX
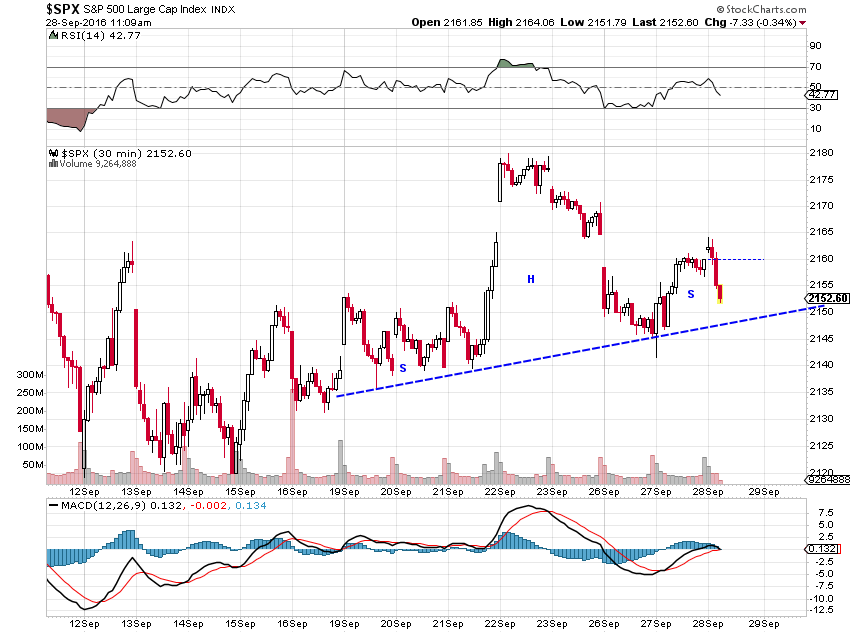
H&S pattern on the 30 minute chart may play out.
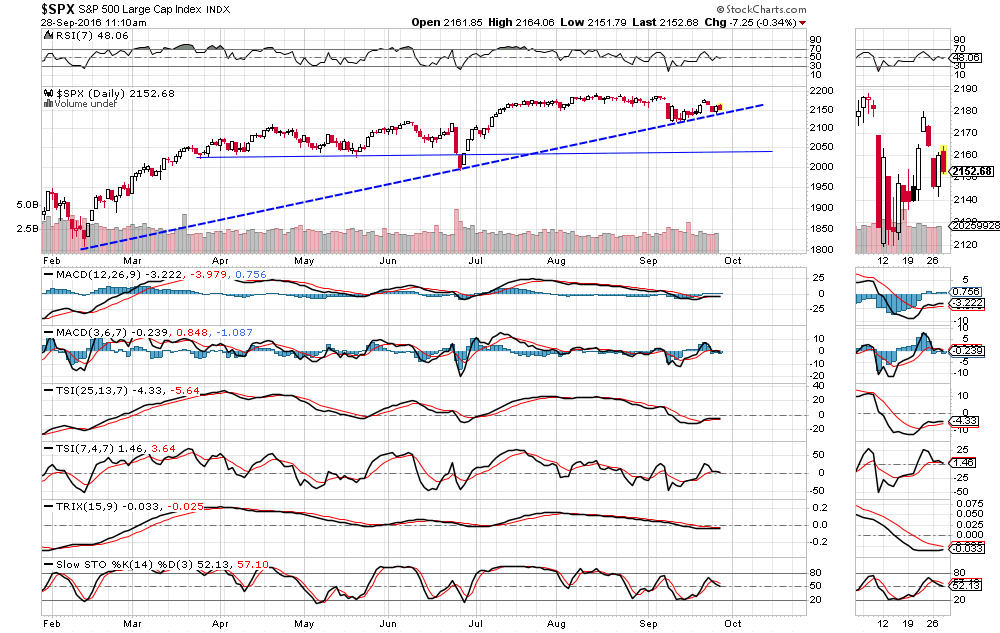
On the daily is the big trendline that may break. If it does I expect a drop to the thin straight support line or so. 2040-2060. Incidentally 2060 is about the 200DMA.
Bonus chart:

Sure looks like a bear flag to me….
Thanks Dadoc, seasonally too, this is a weak time of year till early Oct…One more “Hillary” rally, then kaboom…