EagleSeagle: GDX
I wouldn’t say you are “wrong” per se – I like the way you frame your charts – very sharp. However, I may be looking at GDX from a different perspective.
On the quick – without getting deeply into EWP – I’m not sure I agree with your wave count. I don’t think we will complete a wave I cycle on the weekly chart until GDX gets to the $38-45 area.
Aside from that – I’m not putting too much emphasis on the 2013 high of $30.59 as major resistance, which GDX has actually already taken out on a closing basis when price action is viewed via a monthly line chart, as shown below.
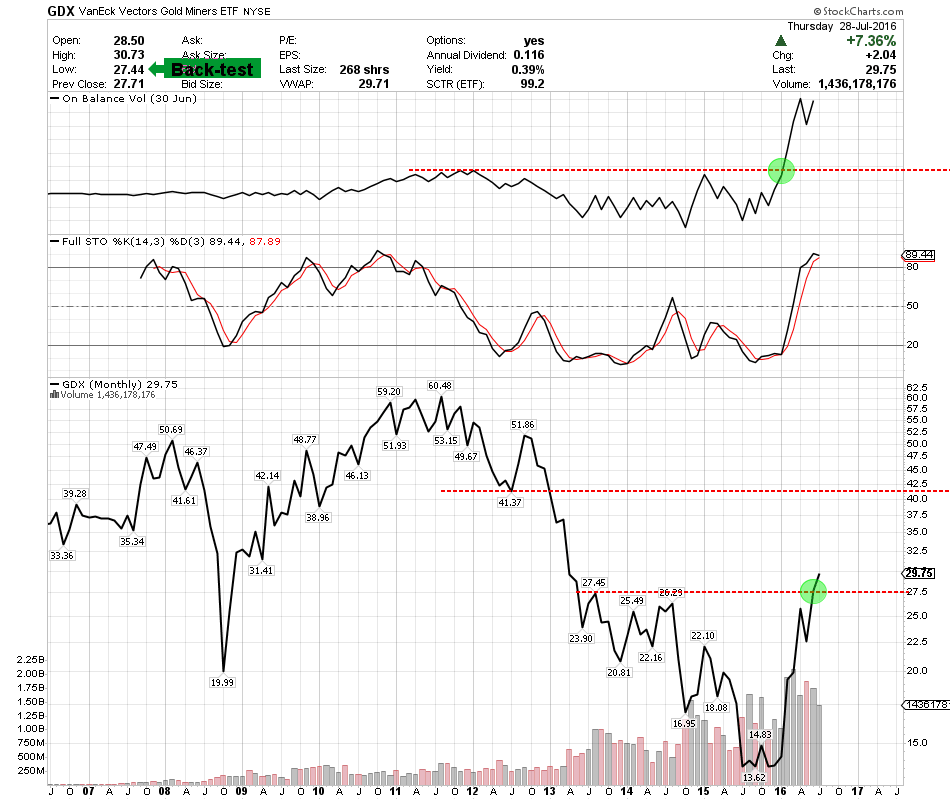
Please note OBV, a leading indicator in keeping with Granville’s mantra of “volume leading price” – which is absolutely crushing the level it reached at the 2011 high, and which appears to be pointing the way higher towards a rapid, reverse symmetry move into the $41 area…
Of course, time will tell!
Best regards –
Many thanks RTV, very informative from a “monthly perspective”…best
Plus 1