WTIC Crude Intermediate Cycle
My chart shows that WTIC is chopping in a Bull Flag while moving down into a Cycle Low (TC Low and perhaps an IC Low as well). The Blue lines show my price channel for this Intermediate Cycle.
https://goldtadise.com/?p=376375
My timing band on Crude TC Lows ranges from 36-50 days on average, so we could see another week or so of downside action (towards the lower Blue Channel support line?).
The Green line was the IC uptrend line which has broken down, signaling a move into the next IC Low. The Green line is also the flag pole for the Bull Flag. 😉
Added: I just added a 2nd chart showing the dynamics of the current WTIC Intermediate Cycle and it’s 3 shorter term Trading Cycles. Notice on the 2nd chart that after my Blue IC uptrend is broken, TC3 makes a lower high followed by lower lows. Classic Cycles behavior.

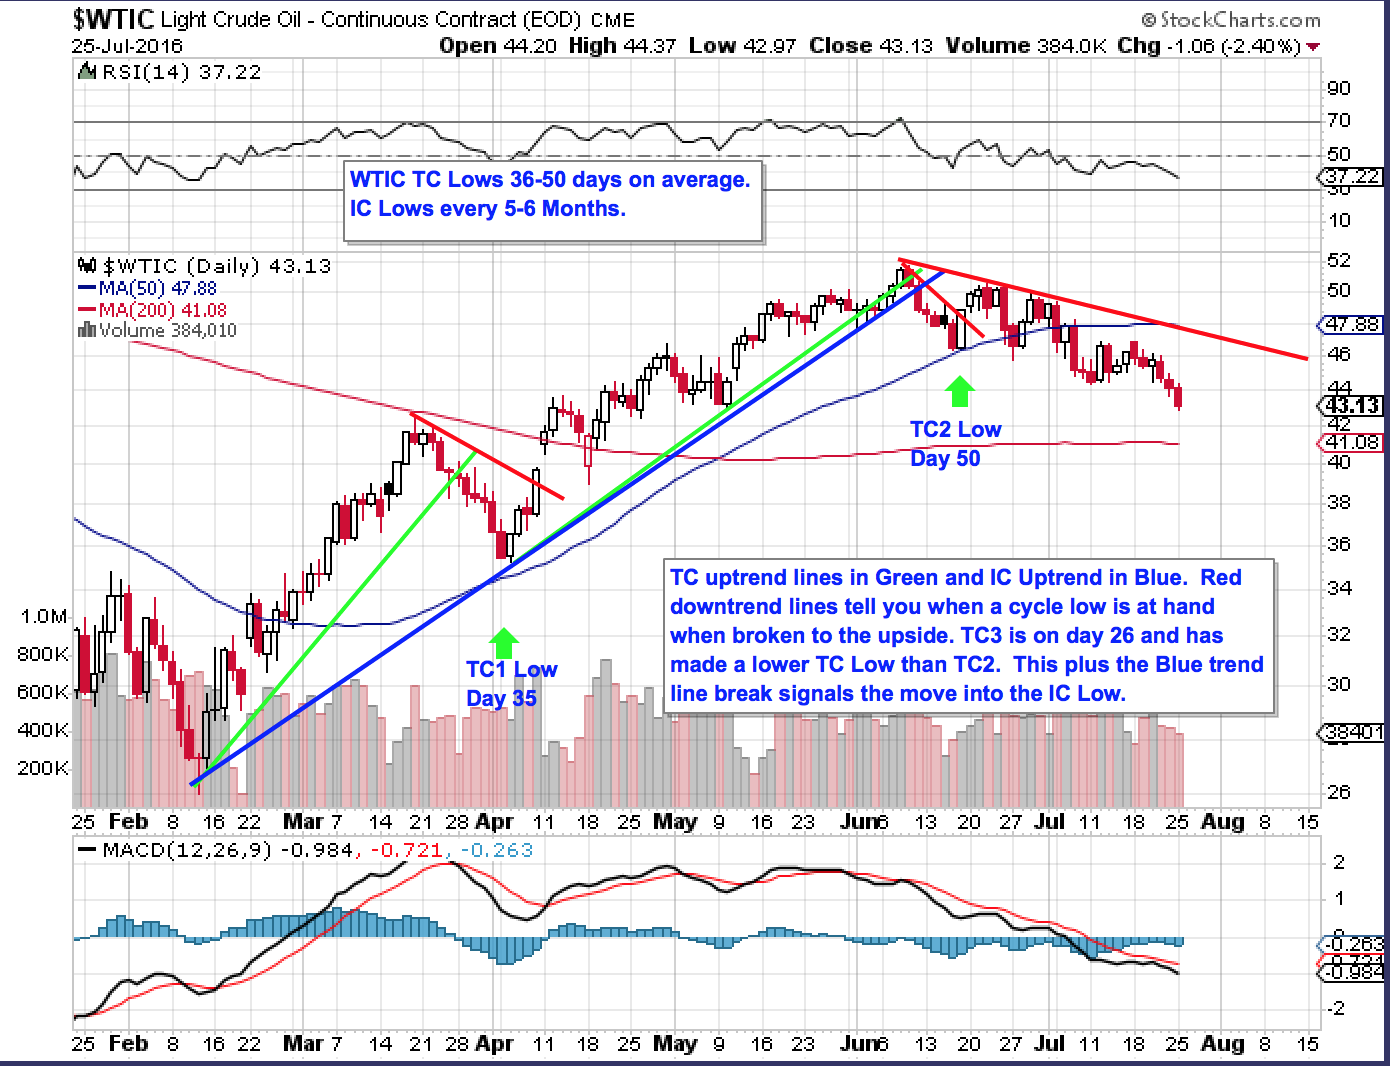
Thank you surf for the chart. on the weekly I have a thought pattern which is a half way pattern of a falling expanding wedge. If we measure a 59% drop as shown to the half way pattern, and apply that to the current downdraft, the target could be around 22. Will have to see if this is even valid.
http://stockcharts.com/h-sc/ui?s=%24WTIC&p=W&yr=5&mn=6&dy=0&id=p91688410907&a=463950141&listNum=15
Kystar, Perhaps longer term it may drop to that range, but based on Cycles, this IC has been very bullish and we have entered the 5-6 month timing band to find the next Intermediate Cycle Low.
I do not expect the IC Low to drop much farther than the 39-41 range but I could be wrong. What is more likely, is that we get a bounce out of the TC Low and then we watch how the next Trading Cycle performs.
Gracias SurfC & Krystal. Oil is an important variable to gold investors (eg me) in oil exporting nations as gold is priced in their fx which depend on their oil revenues.
Thank you very much Sir, the sharing of your knowledge is huge, we are all wealthier because of it!!
Plus 1
Following Surf City has made me thousands of dollars. I always look forward to these updates.