Oil
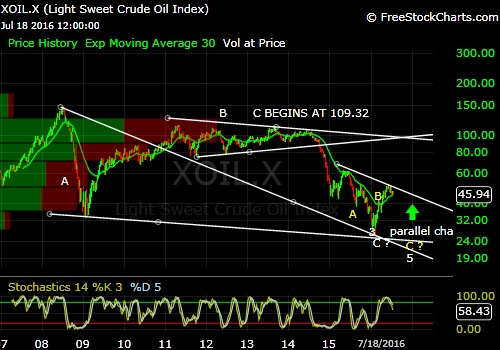
Just wanted to point out some interesting relationships in oil. This is the weekly log. Note the two sets of parallel channels drawn through the 2008 high and 2009 low which control the recent price action.
I won’t go into the details of the wave patterns but simply consider this as an ABC correction from the 2008 high. Wave A crashes, wave B forms a triangle which resolves in wave C breaking to the downside
Now Wave A (white) declines roughly 77.7%. For equality with A, white C should decline the same amount from its starting point labelled 109.32, giving a target of 24.38. So far it hit 26 so maybe that’s it. However until it breaks the channel marked it is likely to at least retest the low.
Also note within the yellow ABC pattern, yellow A declined 58.37% so for equality yellow wave C could go to 21.77. So the most likely targets appear to be 24.38 or 21.77 negated only by a clear channel break