Mark – $CRB
Mark, I have learned a great deal following and studying your posts. Thank you for sharing your talent and know how so generously. I always draw up a chart of my own whenever I encounter new TA technique or a new slant on the market. Often I just dig into my own charts to have a look-see. I have included several of your charts and also charts of other “posters” in my folder.
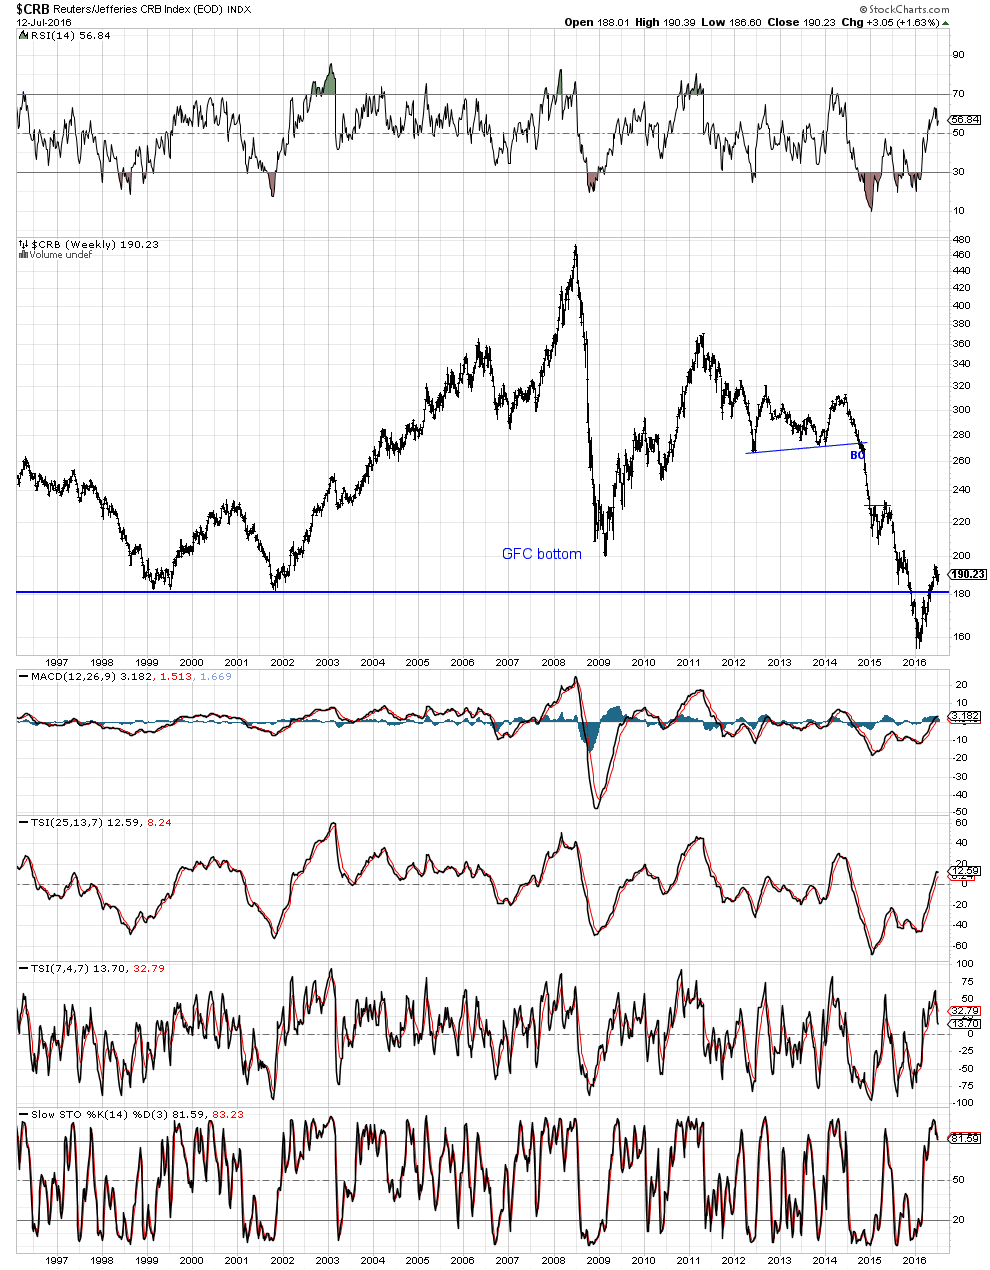
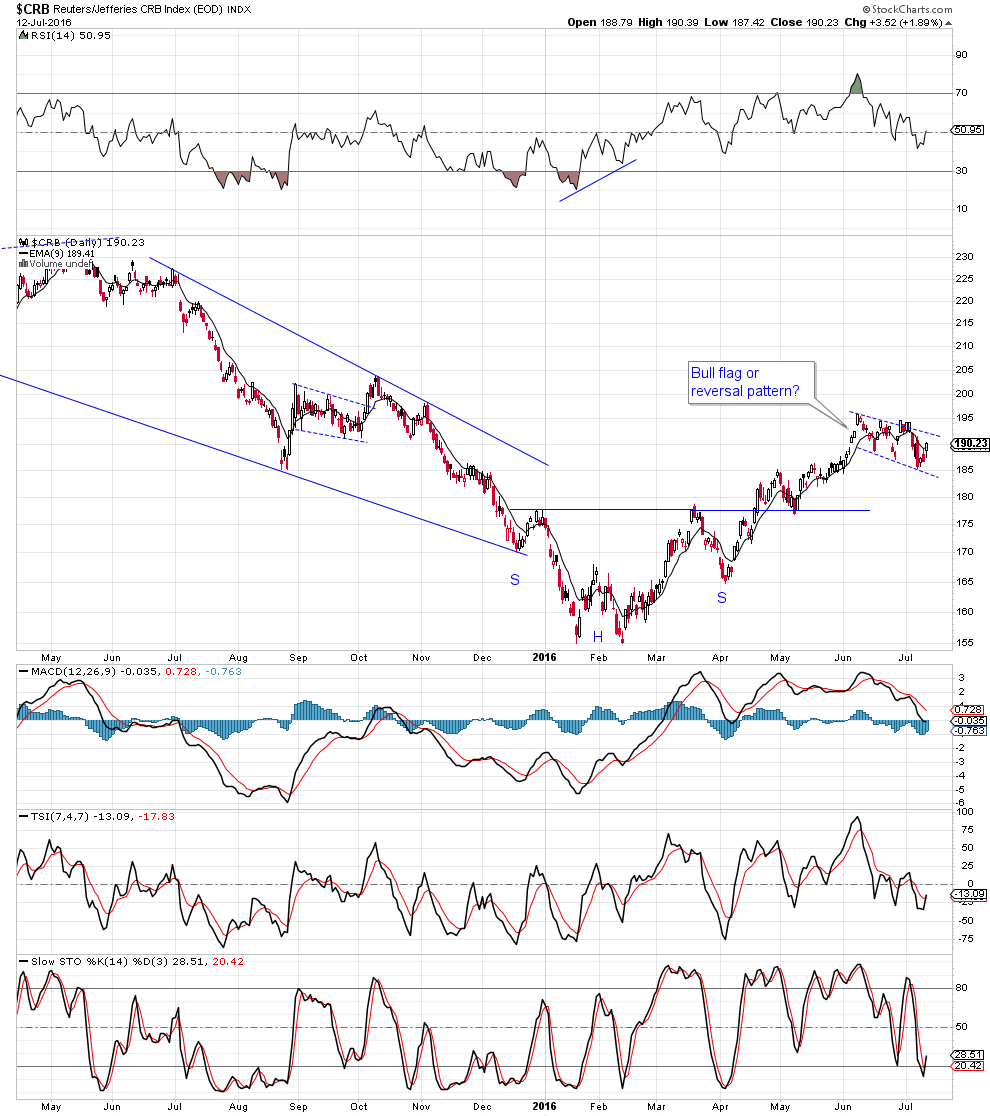
Of course I opened my own $CRB chart to compare with yours. Long story short, I see the $CRB having sliced back up through the double bottom of 1999/2001, and now settling down for a possible BT. I do not mean to imply that your interpretation is wrong – you could very well have nailed it – but I do think we need more evidence to conclude that commodities are to continue on down. I guess we wait to see if $CRB bounces at 180 or so.
$CRB Weekly
$CRB Daily
(I am unable to post in the comment section. Will have to wait until my propeller head techie friend returns from Asian sojourn to help correct the problem)
Nice Work Silver Fox