Gold price in GBP sterling has retraced 61.8% of its losses and more.
I just posted something similar on www.goldtadise.com in reply to Mark’s post.
Mark was looking at gold’s move to $1369 and saying that in USD that is very close to a 38.2% retracement of the entire downmove from $1900+ to $1045 and possibly a point for resistance. I replied:
It is now $1368.70 / $1369.70 Bid/Ask on Kitco, right where your lines meet (1369.90).
High so far today was $1371.90, low $1364.00 (as of 6 July 2016 10:00 BST UK time).
I guess you are looking at the 38.2% retracement of the entire downmove from $1920 to $1045 approx coming in around $1369, approx.
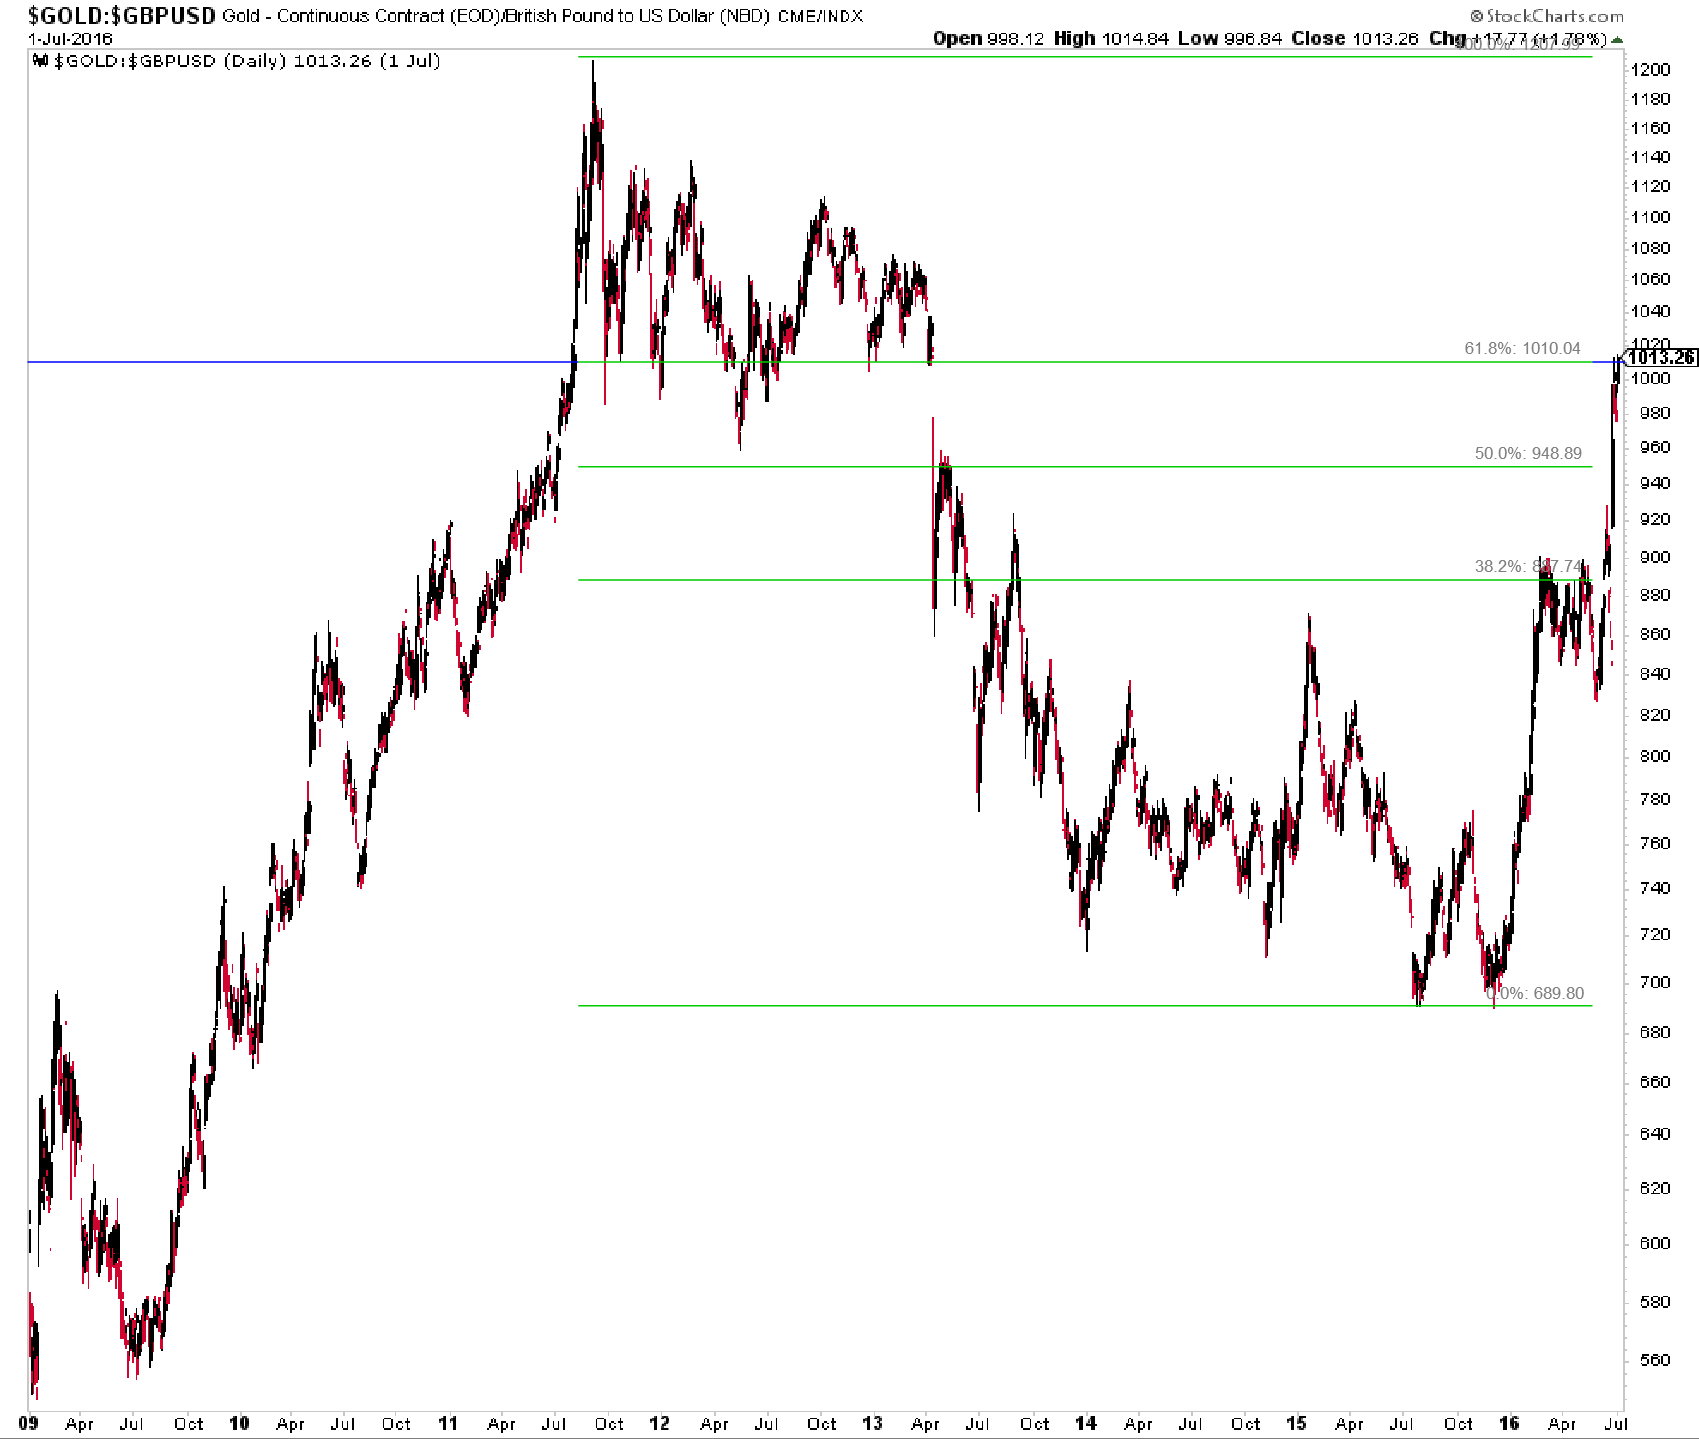
I am looking at gold in GBP and I can tell you that the retracement of the downmove is now more than 61.8% in sterling. Not that sterling gold is the most important gold price to watch but it is interesting to note.
Actually I have taken a closer look and it is very close to 61.8% in sterling. Close enough still to be resistance. Also, today’s sterling price (£1057) has just broken above the upper end of the support zone during the market topping process (2011-2013) which was from about 960 to 1015 BP. Last week’s close price was about 1013 but today’s is 1057 GBP. I don’t know why the $GOLD:$GBPUSD chart is not giving me any of this week’s prices but there you go! I also observe that the initial upmove of gold in GBP consolidated at the 38.2% retracement level! In addiion, I was fascinated that the 1000 GBP level was a most important chart levels in gold in sterling, one of the roundest of round figures. I wonder if that has any connection with the still existing importance of the London gold market?
Here is the chart:
I think it’s all too easy to focus on dollar gold in isolation. In Euro terms, we’re well above 61.8%. We hit a high (per my Bullionvault screen) of 1,386 in September 2012 and a low of 858€ in December 2013. Today, we’re around 1,240 for a 72% retracement.
Cheers for that BobbC. I was going to take a look at gold in Euros but you have saved me the trouble! I am guessing that gold in GBP has just about caught up with it now.