Gold a classic resumption of the bull market.
FullGold Crown was kind enough to allow my posting to this site. I hope to offer something of value to this community, as well as learn from others.
Here is a long term view of the Gold bull market from 2002. Many view the “correction” since 2011 as a full blown bear market. I hope to show it was nothing more than a classic 50% retracement of a ongoing Bull Market.
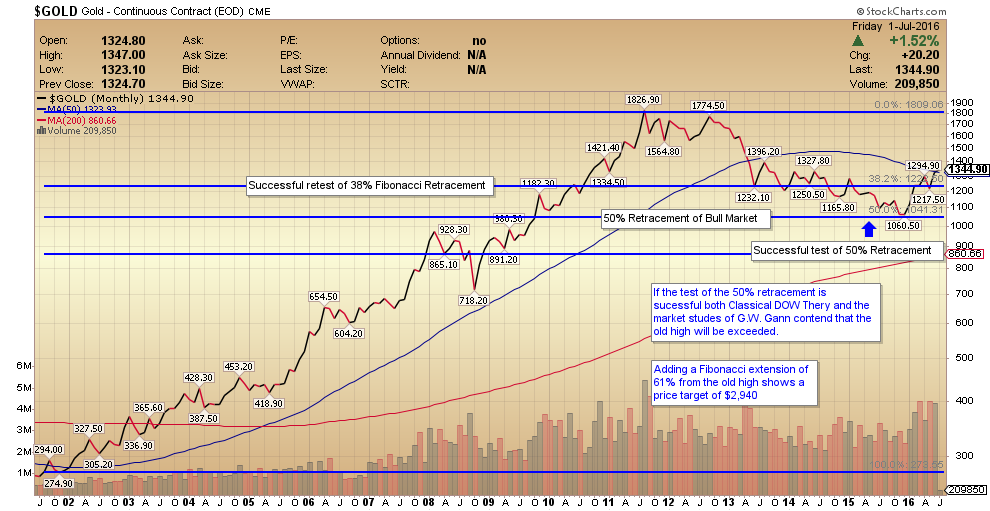
I have drawn in a Fibonacci retracement covering 2002 to the present. It includes the 50% retracement which is not a Fibonacci number but is a very significant number in both Dow Theory as well as the market studes of G.W. Gann.
Both theories postulate that a successful retest of a 50% retracement leads to exceeding the old high of $1,826
Looking at the chart it is apparent that the 50% retracement not only successfully held but lead to a vigorous bounce!
We have also pushed higher than the 38.2 Fibonacci retracement level. (If you look closely you will see this level was successfully backtested in the only correction so far in this advance)
We have also pushed past the 50 day mvg.
To my eyes a market setup does not get more bullish than this!
If we exceed the old high as this chart is indicating how high can we go?
I am going to speculate here in terms of Fibonacci extension numbers from the old high to come up with a conservative price objective.
Given the length in time of the retracement I think a 61% extension of the old high is a reasonable possibility. This yields a price objective of $2,940.
Welcome Gold Tooth
Nice Chart…nice PO
keep them coming
Fully
$2,940. Nice. The way the pound is going that will probably be about 3,000 pounds! 😉
Well, £2,500 anyway.
The pound looks like it wants to test the low of 2002 $1.17 Yikes. That would leverage your gains in Gold.