MUX Example – Distribution
There are so many miner charts right now that show volume distribution from mid-June to now. This divergence is more pronounced than I possibly have ever seen and I don’t think it should be ignored. Plus the bearish wedge fit the volume pattern well. I sold my position too soon but still bagged a quick 50% profit…and from what I recall some of the biggest bulls here were selling some of their MUX positions when I was buying those shares.
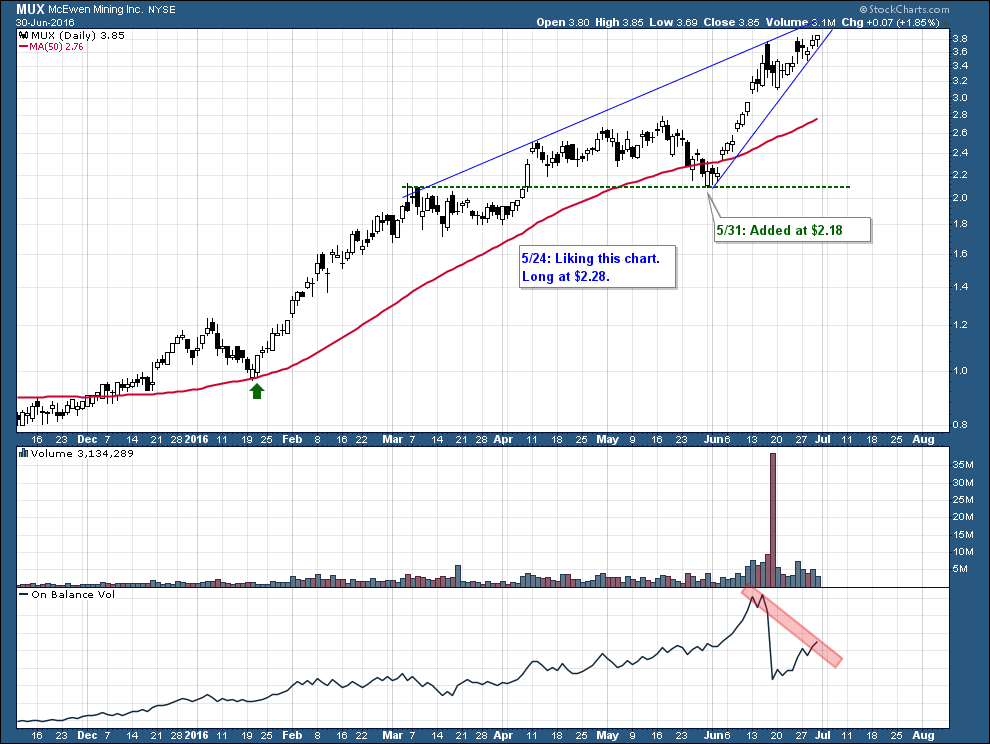
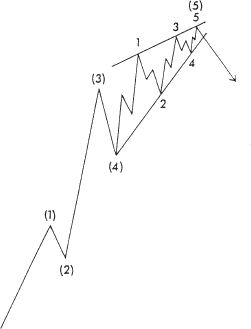
Incidentally, I’m no EW person in the least but at first blush it seems like so many charts like this one (and even the GDX) show a clear 5 wave up structure and are now completing what appears to be an ending diagonal. I’m sure some of EW pros can explain why I’m totally wrong and have no clue how to properly count (which may totally be true!), but I thought I’d throw it out there anyway. Make no mistake, I don’t attempt to use EW in the least but I’m just making a casual observation.
Hi Mark, what is baffling to me is the movement in silver…why is this metal moving up when miners are at resistance and gold may be at resistance?
I know savage is all in with uslv etc
My main point is “Dont these three (gold silver miners) move in rythm as rambus has been showing with his charts?” “If silver is going to go higher then I think, miners may tag the next resistance level at $30ish and gold may test the 1360 number before your scenario plays out?”
What’s up with silver?
Looks like Avi’s EW count is telling him that GDX is going over $35 soon? First chart.
https://www.elliottwavetrader.net/scharts/Charts-on-GDX-GLD-YI-201606261307.html
I know that’s what he’s been saying…massive Wave 3 up coming…and “you ain’t seen nothing yet”, but if you look even Avi has an Alt count on that chart suggesting that a pullback to $20 could be an alternative. That alternative fits my analysis infinitely better. What I don’t understand about EW is why you wouldn’t factor in major resistance levels, deteriorating volume patterns, etc….into your analysis when selecting the favored wave count. I guess I’d be horrible at EW because I cant ignore those factors.
Mark –
in EWT, there are circumstances, such as in an extremely rare and bullish “running flat” correction, where price moves higher during an A-B-C correction phase…which is what may be happening now with MUX. that is, wave B is presently extending above the top of wave I (about $3.80 on your chart).
EWT seems intimidating until you read the “Elliott Wave Principle” by Frost & Prechter. just take it one page at a time and you will soon get it and have it for keeps. You will eventually find that EWT and Chartology go together like tacos and tuesdays! best regards.
Well I have been the biggest bull in MUX since the beginning and I have steadfastly maintained a firm steady hand on the tiller since my entry around $1
My position is now up 300% and its a major position, so include me in those biggest bulls here who were NOT selling their shares.
I appreciate your perspective on this issue as their will be a time to sell it, but it hasn’t been yet.