GDX Weekly – I May Finally Be Alone in My View
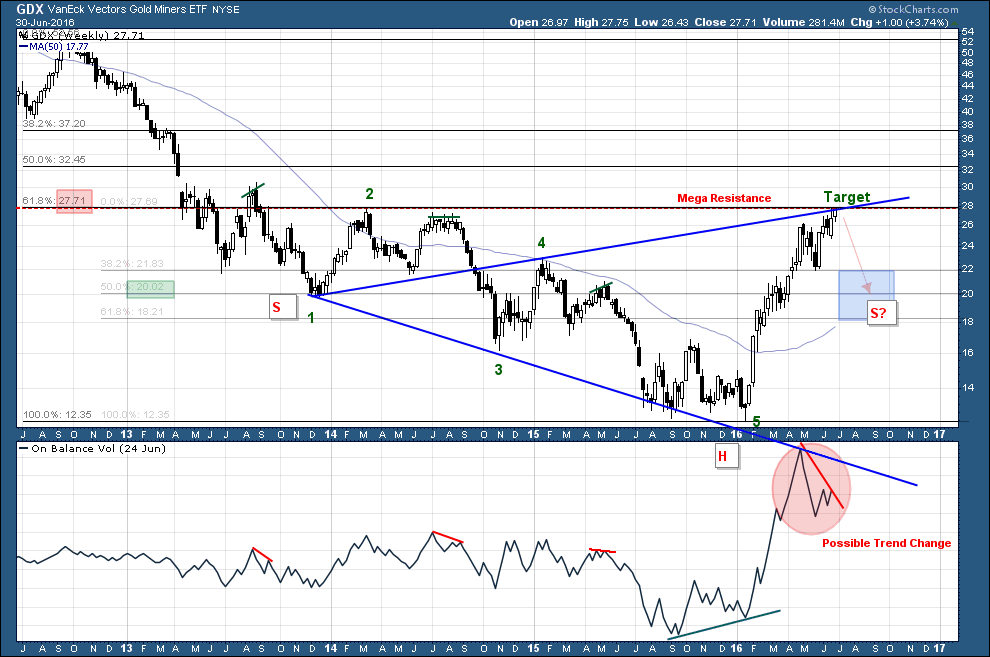
At long last my Wolfe Wave identified last Dec finally reached it’s target which also equates exactly to a 38.2% retrace from the 2012 high. Yes, I sold the last of my longs into the latest gap up fractionally below what I believe to be the peak and I’m slightly underwater on my short positions (avg JDST cost is $8.98). You can see the tremendous divergence in OBV on this view of the weekly…and this type of divergence rarely gives false signals. The structure is bearish, the internals are bearish, and the levels of resistance are ubiquitous. If this were the Dow or S&P, 99% of you would be citing all the factors I have pointed out as reasons to be short….but alas bias and dollar signs are entering the picture so no one is selling into strength. This time is always different, right?
I suspect prices will pull back from here into the highlighted fib zone. To my eyes, a retrace to the ~$20 zone seems to fit best. It would be a 50% retrace from the Jan low, likely create a bounce off the 50MA, and form a really nice looking right shoulder whose structure could create the breakout setup for a run back to the 2012 highs in the mid $50s.
I’m guessing not a single person agrees with me and I actually draw comfort in that if true. One of the most useful aspects of this forum is gauging this group’s sentiment 😉
Sorry, you are not alone in that general perspective.
And, unfortunately, its hard for me to gauge in advance precisely when a move like that might begin, or how far it might travel.
I do think the conditions are ripe, however.
I got several of my best advance alerts for DUST in mid May, but that move turned out to be just a correction for GDX.
Have to assume, though, that we’re in the large Elliott B wave that some of us expected … at some point. This rebound qualifies for the first leg, no doubt.
A stronger second leg up to 1450 au is entirely reasonable, after some kind of retrace.
I’ll post if I see my alerts.
I would like to see some confirmation before jumping into a short that for sure… gdxj channel i posted earlier has a raised floor now.. if the raised follow gets taken out.. then it would catch my attention…. Hui im still showing it could go higher on weekly.. like to get your take on that. (ie:252 to 260 something area is possible).
Ive been trying to be as objective as possible, but i just dont see anything bearish right now. You do have some guts in taking this short.. i will say that… and the bullish sentiment might be a warning; but i would like to see it reflected in the charts.. perhaps your volume divergence is the warning.
Im wondering.. any reason you prefer the gdxj short vs the gdx short or are you short both.
I am short both….via DUST and JDST. Both entered pretty much simultaneously.
Mark:
I am not savvy enough to disagree with you, so count me as just interested in your views. If it wouldn’t be too much trouble, where do I start learning about wolfe waves. I don’t want to pay $3,000 for the seminar, but it’s mentioned so much on this site that it has piqued my interest. I’d love to be able to plug it into Metastock as a study.
Thanks and I appreciate your contributions to this site. IMO you are one of the most valuable contributors, even if you sometimes are “contrarian”.
Jim
I think alot of people agree with you Mark. I don’t own any of the ETF’s but am loaded up with micro/nanocap juniors. If I owned GDX/J I would definitely sell and wait for a possible pullback. Microcap juniors do their own thing at their own time and don’t necessarily follow the ETF’s and larger mining companies. I think many people here also own the smaller juniors and are holding tight for now. I have some bids in on some juniors right now but I am not buying anything that has made a major move.
Every single junior I own is undervalued and a potential takeover target so I am not going to try and trade them. If/when they become overvalued then I will definetly sell, but they need to triple from here to get to that point, at todays price of gold and silver.
I don’t see any analysts pumping to buy mining stocks right now. They are all waiting for the inevitable correction to load up. Edelson, Maund, Marty, Moriarity and the many others I follow are all bearish right now because a pullback HAS to happen soon. It probably will and if it does I will load up on GDX/J call options like I did in December.
Heh, likewise I find it incredibly useful to gauge Mark’s sentiment :).
No really I’m serious. Mark, you may be the lonely bear here in this micro-bull corner of the net, but between your bearish bet now and the anticipated new-high bounce up – the vast majority of $ (USD) are Central Bank believers, PM skeptics and 401k sleepers on the sidelines yet to be convinced (and not by a vaccuum of information as I’m guessing would support your EW thesis playing out) – who are still unaware of how little their currency will buy tomorrow – that sentiment could easily turn on any given news event. Yes, inflation is low but the trend over the past year is almost undeniable. I don’t want to be short (even as very technically sound your positioning is), as the crowd awakens. I truly wish your thesis all the best Luck, the bulls need a dip to bring in more $ to the party – I can’t hit a $mill in PM’s without them.
Sorry, meant to say WW, not EW thesis.
The Wolfe Wave thesis already did play out. Target hit exactly as predicted from Dec. From here Wolfe Wave theory doesn’t predict where a pullback will lead to, it simply suggests exiting the trade now. I am suggesting that fib, chart pattern, and MA supports would make sense as they tend to form a confluence around $20.
well, Gary Savage says 15 more weeks until gold hits a cycle top, others from this forum say “sit”, some are looking for a strong Wave 3 up, and other are looking at raised target levels from here for silver and the HUI. One thing is clear from the OBV pattern…sell volume has crushed buy volume on the late-June move higher. It looks like institutional selling and retail buying into higher prices pegged at GDX resistance.
I live in Vancouver. Nobody is talking about mining shares or gold/silver. All the talk is about real estate and buying the dips in the stock market. I don’t know of anybody who is positioned in this sector. I don’t think retail is bidding these stocks up.
Don’t ever listen to ANYTHING Moriarity has to say. The man is a moron.
http://charts.dacharts.net/2016-06-30/d2268.png
gdxj channel again but pricing has not been update since early this moring…. this chart could be interpreted in more than one way; we have a possible slanted inverted head and shoulder possiblility.. actually 2.. one is much bigger; however, it could also be a “giant” slanted head and shoulder possibility if it can not take the brown line above where last resistance was.. if its the later… you will get the correction you are thinking of; but for now.. short term, we have the raised floor.. i dont know on this one
Mark, I am also loaded up with micocap juniors as my core but have sold most of my more liquid trading shares into strength the past couple of days. I have also started a hedge with JDST and will add on more confirmation.
Ok, this is disheartening. I was hoping for more vehement protests suggesting I was completely out of my mind. Perhaps I need to rethink my approach.
😉
Mark you are not out of your mind, however I would describe your position as expressed on this forum as militantly bearish against the trend. Eventually the movement will confirm your view, but until it breaks it is fire you are playing with.
based on the short term .. im currently favoring a run up to the green line on the chart i posted earlier; but let me say the raised floor has to prove itself still.. i will say if it reaches the brown line before taking out the raised floor.. then a run up to the green line is likely
Mark, your posts are much appreciated. I think your charts are very instructive. I have found I am not a very good trader and am happy to stay long in a bull market. There will be times I take some off the table but I don’t plan to get out completely until I think the bull has run it’s course, hopefully many years from now. For example, I did sell half of my GPL near the top as it went parabolic, and bought back in today. If you are correct and we see the correction you are talking about, it will be painful and I won’t check my stocks as much for sure! I also can’t watch the market every day closely and I don’t want to get too cute with getting in and out. Thanks for your input.
Chap, this is the correct approach and strategy for 95% of the people on this board and 99.7% of investors in general. It’s good that you have come to the place where you understand this.