Fully —GDXJ Weekly Updated
I think the essence of that chart from months ago is still in play and upside targets are as well. I’ve simply ratcheted back the initial resistance for a corrective move by one fib level down and here’s why:
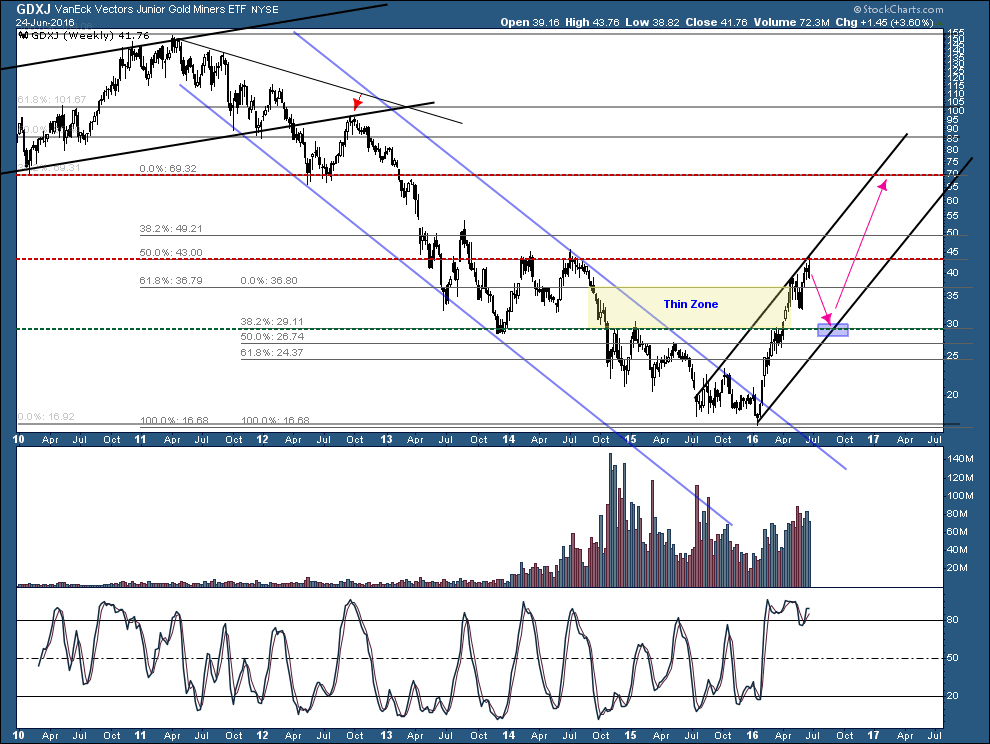
1. $43 fib level matches multi-year resistance;
2. Prices are at channel top resistance;
3. Bearish wedge into multiple resistance levels;
4. Clear signs of selling into current levels based on A/D levels;
5. Thin zone below where prices historically have shot up and down quickly. These zones often act similar to gaps and often get refilled.
6. Negative divergence on many indicators.
Again, I’m not denying we are in an uptrend but I feel current levels are quite vulnerable to a healthy correction due to mainly a confluence of resistance and I’m sticking to my system of selling resistance.
Excellent reasoning Mark
Thanks for the update
also note my 2012 red arrow which has been on this chart for years which marked the backtest, confirming the multi-year downtrend had begun. A bullish backtest now would also possibly confirm a new multi-year uptrend has begun.
Mark, if your strategy was to sell resistance, you would have been selling all the way from GDXJ 23 or so?
Although I try to describe my approach as being simplistic, it’s not quite that one dimensional as most folks here know I was long all year up until I completely loaded the boat in late May. In early June I sold all my long positions and started building a short position in the miners. Although I made good profits on the short side this month, the structure didn’t develop into what I expected despite tagging resistance similar to where we are now. So earlier this week I went long NUGT again which I sold yesterday and started rebuilding a short position. What I’m saying is that I don’t use simply a tag to a possible trend channel top as a signal to sell; I evaluate many timeframes from intraday to monthly and also look at where the metals are as well as currencies and bonds. I prefer to find a confluence of support or resistance to place larger bets one way or the other.
ok kids….Mark’s work projects a 30% Correction this summer
Strap yourselves in
Sell ? Hedge ? or just ride it out .
Good Luc to all Goldtent People
Fear not…Gary Savage says 15 more weeks of sunshine and butterflies.
If I owned an ETF like GDX I would probably sell. I own 20 silver, gold and zinc microcap/nanocap juniors. Everyone of them is a takeover target and is still very undervalued IMO. I am going to stay long until they are taken out or overvalued. They are all cashed up now or are producing profitably so there is no worry about them going under unless the PM’s tank hard. Most of my juniors do there own thing and don’t necessarily go down when the ETF’s do. I am going to ride it out with no hedges. Surprises may just be to the upside and we get a 30% gain this summer? Who knows.
I will probably hold what I have and add as much as I can at the pullback. I’ll try to get my family to move some money into gold mining stocks as well. They likely won’t listen though.
At the neckline now, then down to the right shoulder. 🙂
Then you have an inverse head and shoulders which have a 98% validity rate.
https://www.youtube.com/watch?v=CGW0h80gKW4
Yes, for the past 2 weeks Ive been watching the same IH&S playing out possibly on the GDX weekly. It suggests a pullback to $20 before launching. Sometimes all roads leads to Rome ;)You may possibly be the only other person this board who sees the real potential of this playing out. Longs are cool and collected right now but make no mistake about it, if GDX gets into the low $20 from here they will all be running around with their hair on fire.
Tommy …NOOO…No Pattern has a 98% validity rate …NO Way…not even close…where are you getting this from ?
IF this were so Everybody would make money on every H and S Pattern
There are 2 things to consider here
1…If Marks pattern plays out and we get a nice right shoulder…that’s a Potential Inverse Head and Shoulders Pattern
It is NOT an Inverse Head and Shoulders pattern until the neckline is broken
I would say maybe only 55 to 60% of POTENTIAL H and S Pattens actually break out.
2…Then IF the pattern does breakout above the neckline the pattern is complete and you can work out a Price objective
Mesure the distance from the head to the neckline and add that to the neckline
I would say maybe 70 to 75% on the POs actually work out !
My numbers are an estimate ,,,but I have see many many Potential H and S Patterns be negated …happens all day every
day in all time frames !!!
I have to agree Fully. According to Bulkowski, 74% of these patterns that breakout meet their target. No chart pattern has a 98% success rate.
http://thepatternsite.com/hsb.html
and 74% is VERY GOOD
Thanks Mark
have a look at $CDNX using same parameters. this index is heaily weighted to small cap miners and explorers.
Mark I see that you drew the chart in log scale. I would recommend that you draw this again in regular scale as I see that PO is higher is higher at about 33
Nice work Mark!