NEM Example of Correction I See
Yes, not a popular view here I know but I have zero bias….zero…I don’t care about sitting tight or what world economics and politics suggest or what some cycle interpretation tells us, these are just charts to me and I trade them the same regardless of what the underlying equity name is. Let’s be honest, if this were a chart of the S&P or RUT, 99% of you guys would likely interpret this the same way I am….but it’s a PM therefore only the most bullish outcomes are the most likely in most people’s minds.
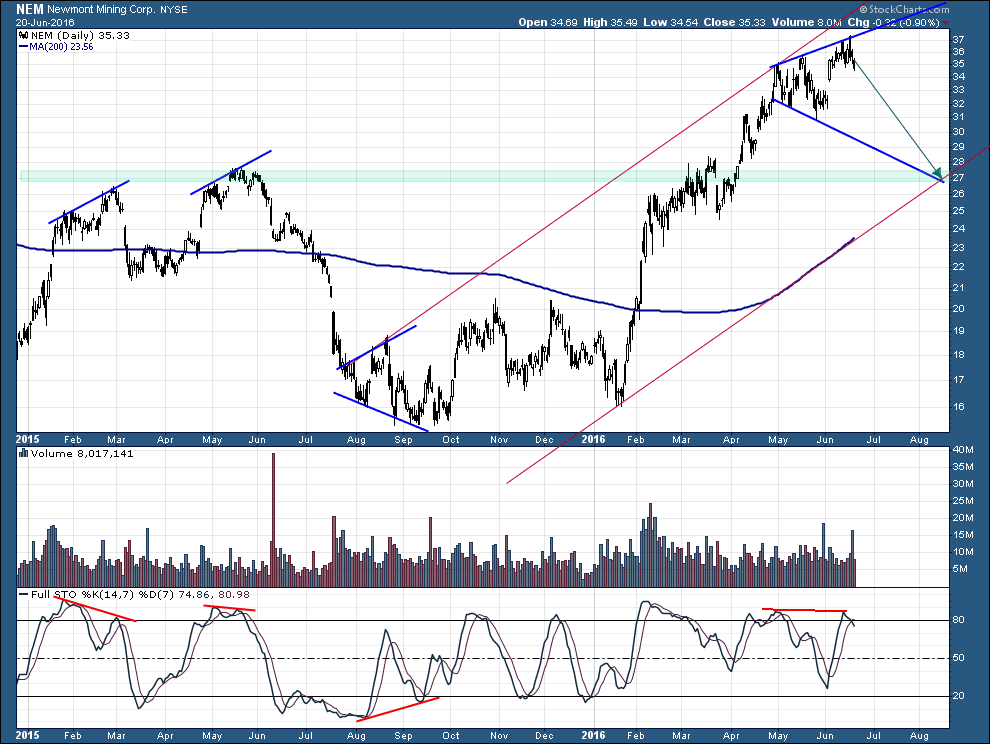
NEM is setting up classically to correctly back to a confluence of broadening wedge support, channel support, key S/R level support, and 200MA support….all converging at $27. That’s a 22% pullback….if that’s within your risk tolerance for a “possible” multi-year bull market taking form then just sit tight and sweat it out….I suspect many will end up selling at exactly the wrong time because the pain becomes too great.
Back up the truck at NEM under $28.00 my friend. I’ll be sweating this out personally if it happens. I do not want to be caught on the wrong side of this raging bull.
and this is where we disagree. I’m driven by preserving gains and capital and you’re driven by possibly not participating in every penny of upside. If I miss a few pennies on the way up I’m ok with that because I will be protecting gains and trading capital along the way. Do you have an exit plan or will you just “know it when you see/feel it”?
I cant disagree with buying in the $27s if the structure supports it. I do disagree with sucking up a 22% drawdown along the way with the underlying premise being that you KNOW it’s heading higher than the prior swing high. Nobody knows this and the only certain in trading is cash. I’m driven more by locking gains and capital preservation and not buy missing out. I may miss a few pennies on the way up by protecting my money but that is a more appropriate approach for me and I believe 99.9% of professional money managers as well. Do you have an exit strategy?….or will just know it when you see/feel it?
Very Reasonable Target for sure
The 200 Bottom had 5 drops of over 20% in the first 6 months
This has been an easy ride by comparison