SPX Monthly: 3 – 13 MAs
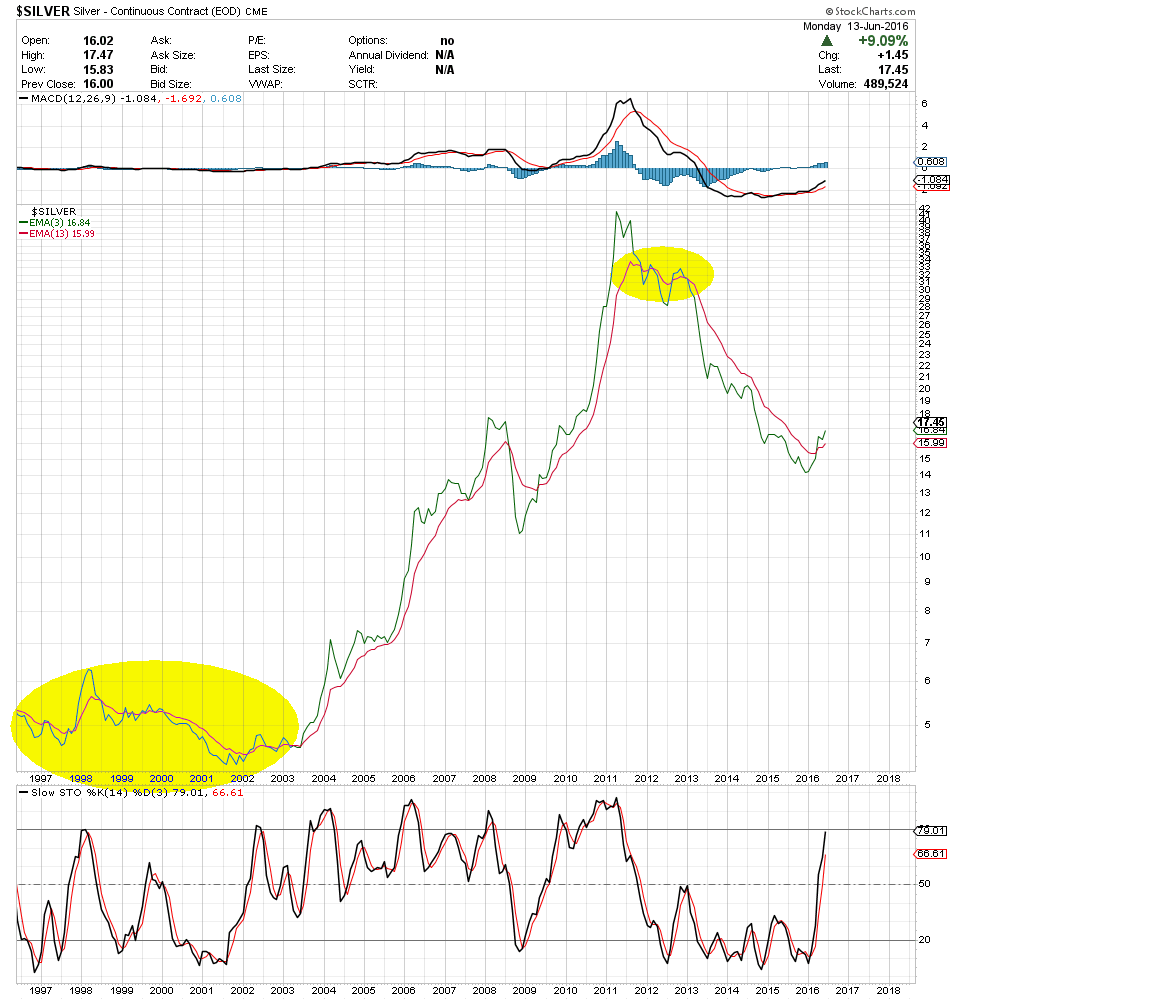
Great community here! I Appreciate the positive comments on the long term 3 – 13 MA charts posted last evening! Just a word of note – this type of long term chart should always be viewed within the context of stage analysis, MACD crossovers, and other TA tools, as MA crossovers become less reliable (whipsaw) during periods of transition. The $Gold chart posted yesterday looks pretty clean, while the $Silver chart is more instructive in this regard.
With the foregoing in mind, below is 3-13 MA chart for the S&P:

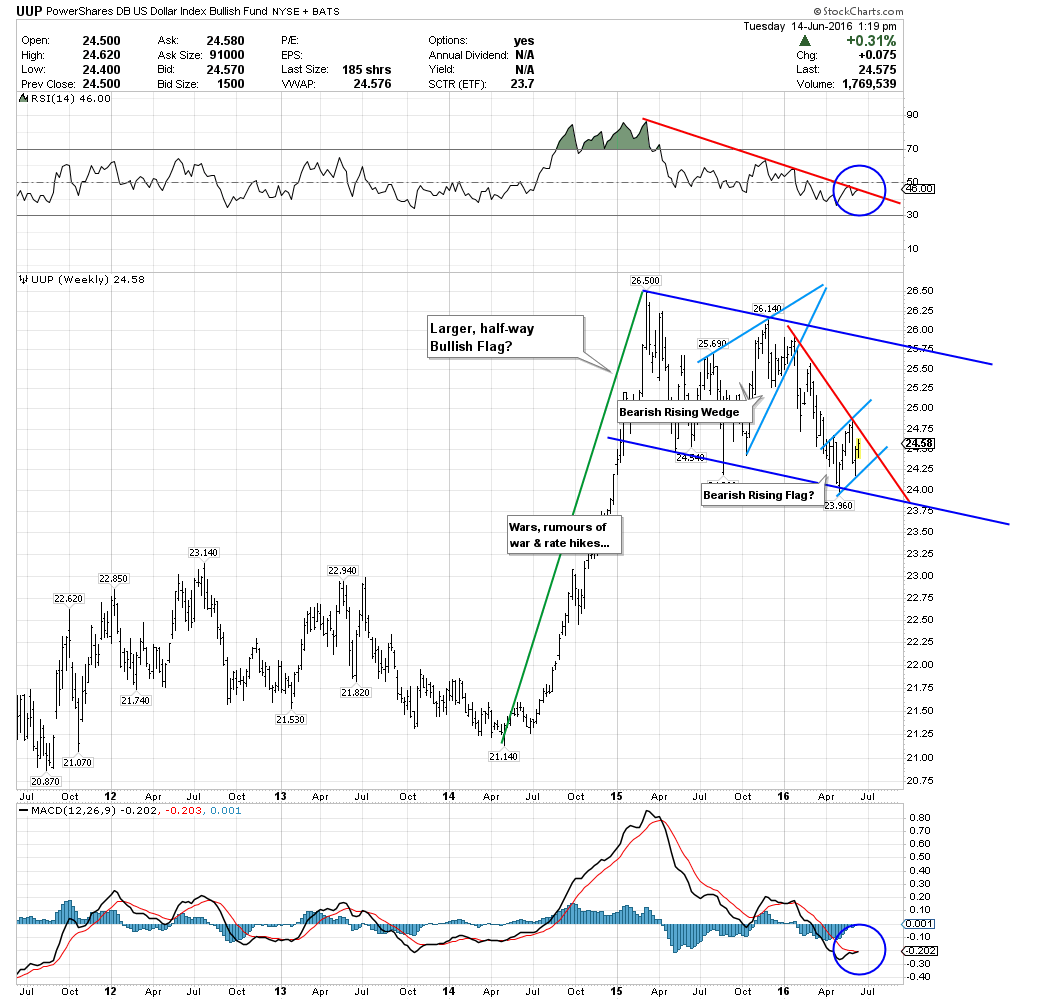
While I’m posting, we’ve arrived at a critical juncture for the $USD, as shown in the weekly chart for UUP below. Is it possible that gold and the dollar will rise together should the UK Brexit? I have no idea, but will be watching with interest…
(NBA draft [Go Lakers!] – and Brexit vote both on the 23rd…time to break out the popcorn!) 🙂
It is an interesting way to look at price action. AAPL has had a nice run but looks like the trend has switched. I really do not like the DAL long term chart as I am employed by them. I have a position in CLF that is looking like it could be a long term hold. Still need to keep the weekly and daily in mind for entry points and stops to protect profits I suppose.
your right chap. pm sector is the “jim dandy” of volatility, but then that is why it is always important to keep the long term view in mind.
Great stuff RTV
Thanks