$HUI: Daily
Two ways here of looking at the same chart…
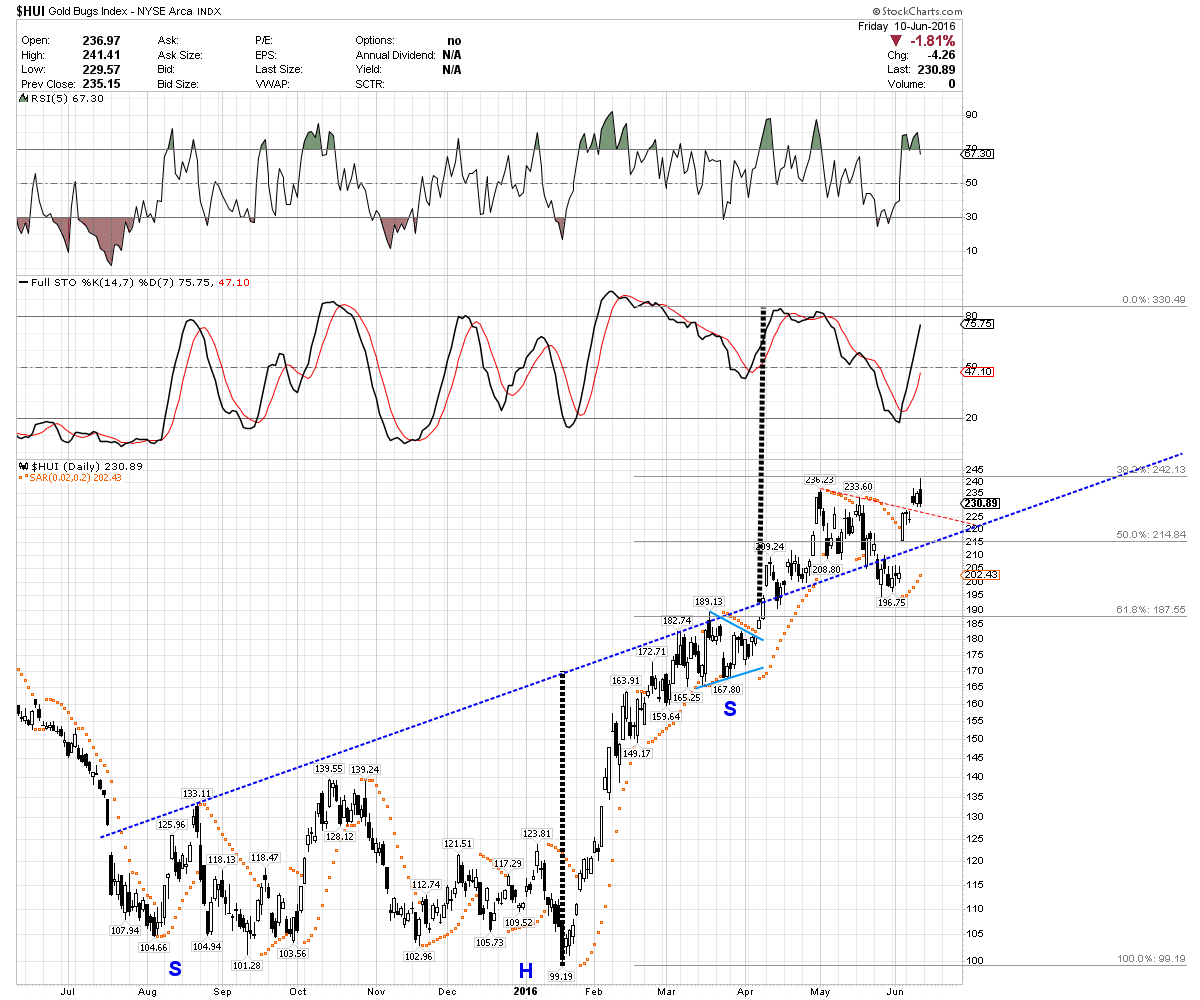
In the first chart, I still see this bullish H&S formation in play, with a recapture of the neckline (blue dotted line). Thus, I see more price flexibility here and will not be too concerned with a pullback below the recent breakout of trendline resistance (red dotted line).
Instead, I’ll be more focused on price remaining above the neckline, which maintains the H&S minimum PO of about $330…
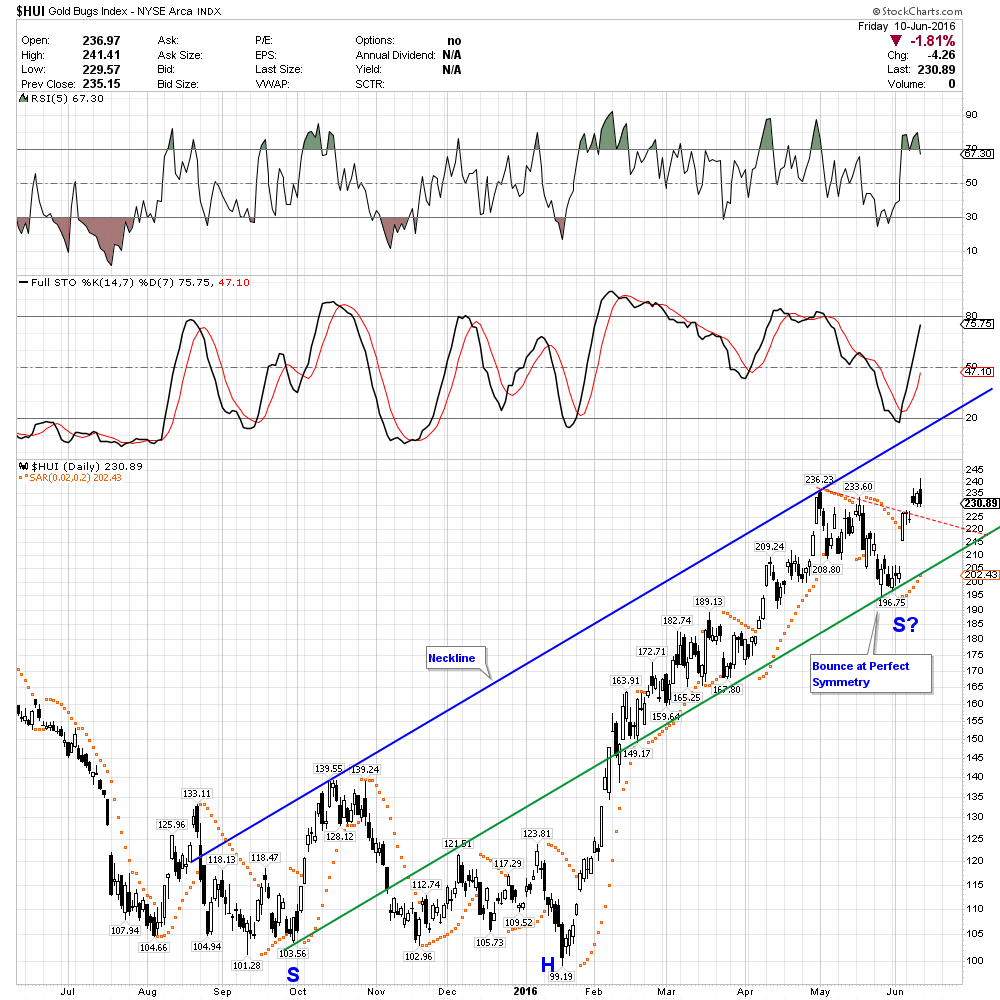
Same chart below, but with a new neckline drawn. Note the recent bounce exactly at the parallel (green) line connecting the left shoulder to the new possible right shoulder. This kind of perfect symmetry provides some merit to the potential formation. It would also give price some additional leeway in terms of any near-term pullback.
Nice charts. We are on the same page here RTV. Have been following the inverse h&s´ from when they broke out. As I see it, they are the real shorter term reversal patterns.
I had them in my last post on roadmaps:
https://goldtadise.com/?p=372544
Absolutely, Graddhy – some bullish formations “in play” – some “under construction”…love it!