Stock Market (SPX) Intermediate Cycle Update
Stocks are in an interesting spot here as I have two possible Trading Cycle (TC1) counts out of the Feb IC Low.
One is Bullish and the other Bearish.
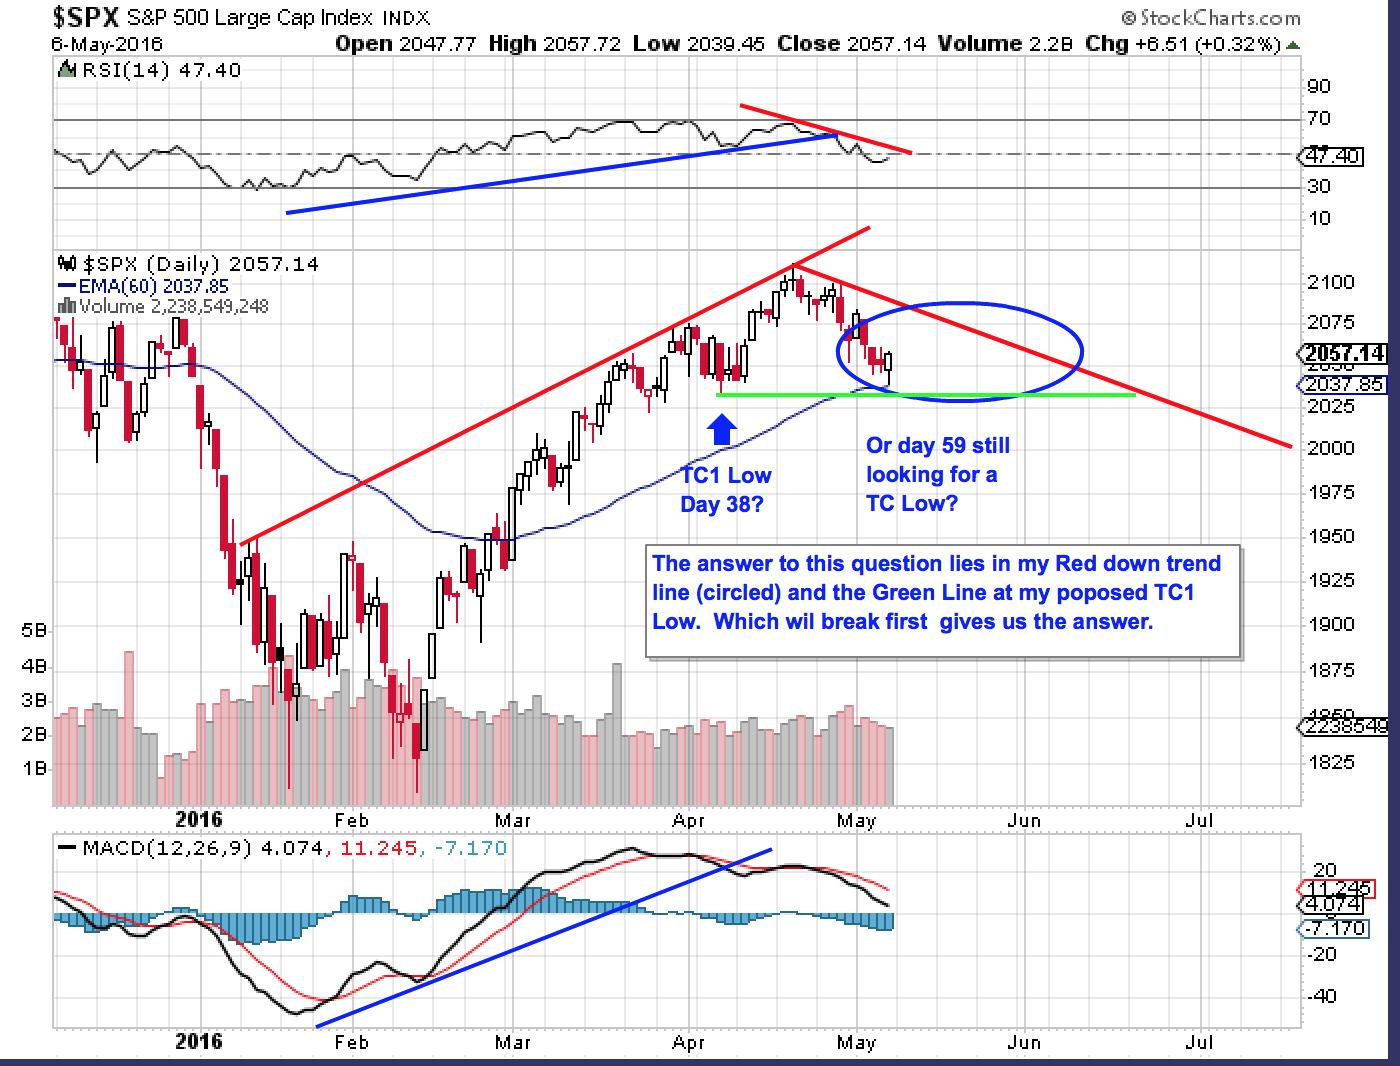
Several Cycle Newsletters, in public posts, feel we are on day 58/59 here and seeking out the next Daily Cycle Low (my Trading Cycle). This is one of my scenarios but I think there is also second scenario that needs to be considered as well.
http://blog.smartmoneytrackerpremium.com/2016/05/weekend-charts-3.html
The second scenario has a TC1 Low at 38 days were we potentially had a mild TC low but within my time band (36-45 days on ave). Under this second scenario, we are now on day 21 of TC2 and close to failing (i.e. making a lower TC Low).
The first scenario is that we are on day 59 and still looking for the TCL or DCL as others call it. Several Cycle newsletters have this view while my bias is towards my second scenario. I have circled the area on my first chart show the wedge forming (Green TC line and my speculative Red IC Downtrend line.) Scenario # 2 leads to the Green line breaking while scenario #1 has a breakout above the Red line in my circle.
This is very important as I am expecting the next SPX IC Low in the June/July timeframe based on time. A breakdown below the green line will likely lead to a lower IC Low while an upside breach will likely lead to a higher low based on time.
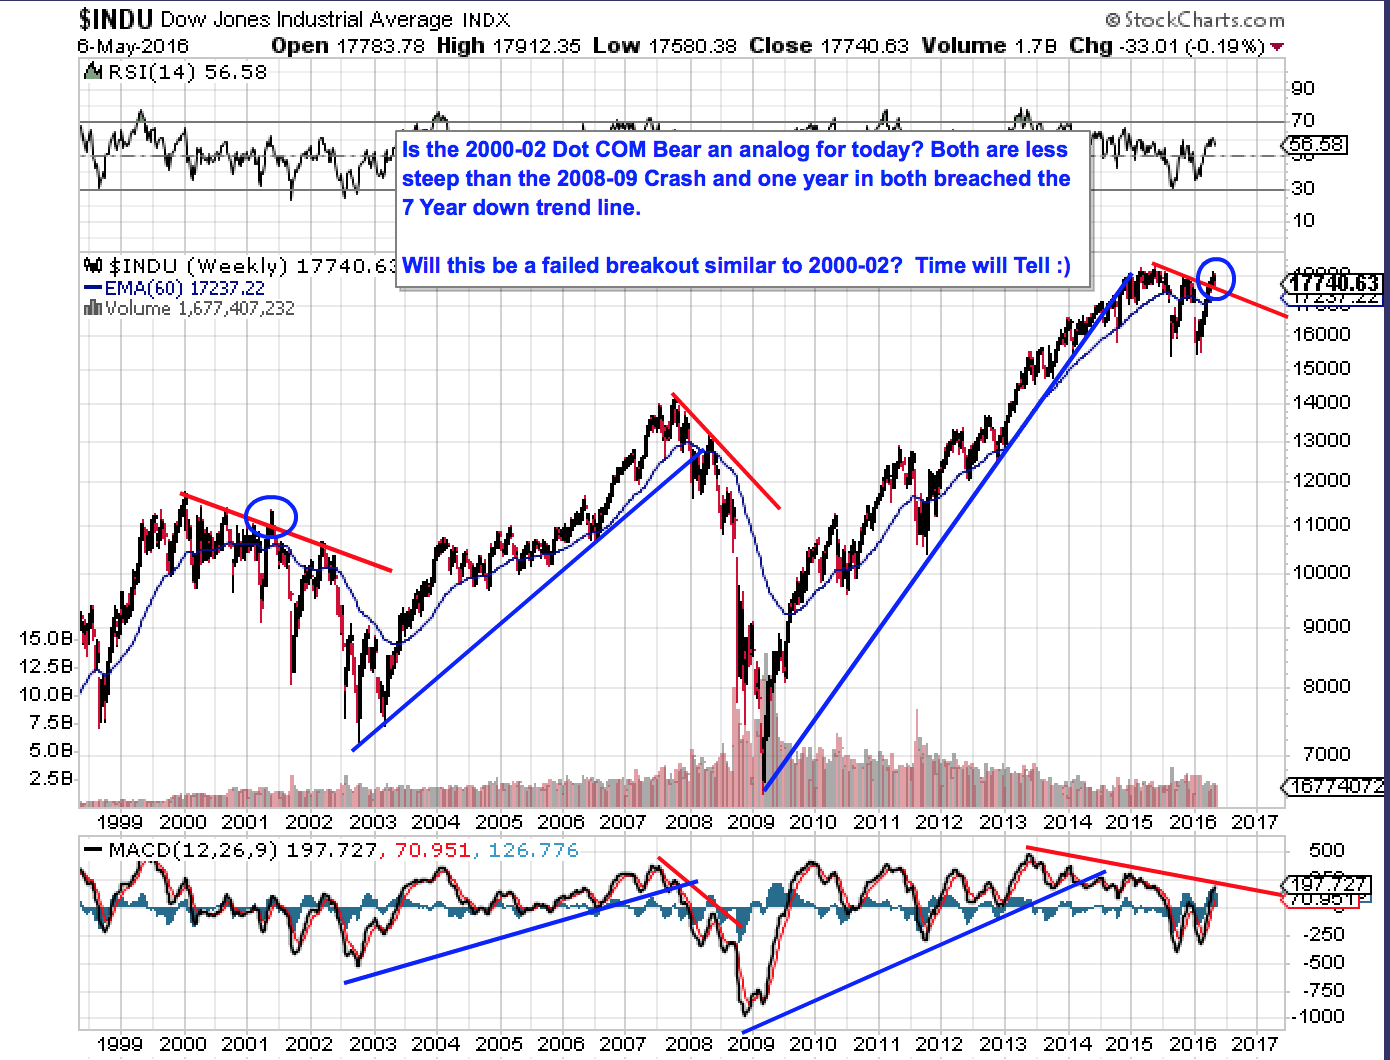
The Bullish case is bolstered by the Dow, Trannies and other indexes breaking above the 7 Year downtrend line during this rally. My second chart, however, is a long term weekly showing the “2000-02 Fractal” where we had False Breakout on the Dow above the 7 Year downtrend line (also in the Trannies and other Indicies as well).
Other Cycle Gurus has cited that the current break above the 7 Year line signals the end of the Bear but I think that the Jury is still out on that front based on my 2000-02 Fractal.
Mr Market will decide that for us so stay tuned. We may even see an oversold rally into mid May here but which way price breaks out of my wedge in the first chart will likely give us a clue to the longer term health of the stock market.
Footnote: I took profits on BIS BioTech short Friday as we may bounce here. No other shorts here. Still long PMs here and mostly in cash for my stock market allocation (plus a couple of Longs that still have Bullish charts).
I personally think the charts are setting up for an S&P move higher here. I think the red dashed line on the chart is an important S/R level. If this were a chart of gold, 90% of you would be buying this dip.
http://schrts.co/adBa4E
Mark, I agree that the are two possible scenarios (bullish and bearish) depending on which cycle count. The Green and Red triangle is the key for me and that is why I am basically Flat in my stock allocation account waiting for resolution.
I could also see a bounce here to say mid-May up towards the Red line which would also build out the right shoulder. Again the two cycle lines are key here.
Watch the “Wedge” for a breakout in either direction.
I expect it may also chop a bit here starting with a move up towards my red line.