Looking Back and Turning a Chart on its Head
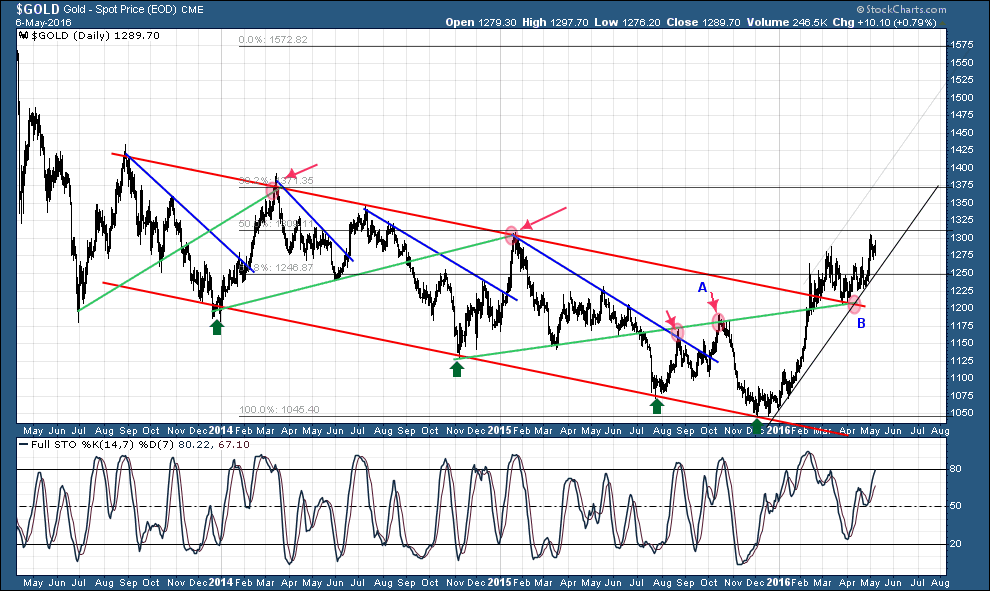
Here’s a chart I originally posted here back on Oct 13, 2015 which suggested a good risk/reward short position in gold at the time (Point A on updated chart). I like using confluences of key support/resistance levels.
I updated it today to show that trends change when confluences become support and no longer resistance. I also placed what I think is a nice fib fit. Point B was the confirmation of the turning point. So this chart has some useful life left but we need to view it upside down now…it will be fun updating it along the way ;)…but it will also be useful for identifying when we might need to get off the train.
Mark, Great looking chart . Thanks for posting.
Very nice chart Mark. And I would like to add that the back test of the downtrend line was beautifully captured!